Next: Real data
Up: NUMERICAL EXAMPLES
Previous: NUMERICAL EXAMPLES
In this section I discuss the results obtained by applying the scheme to
three synthetic data.
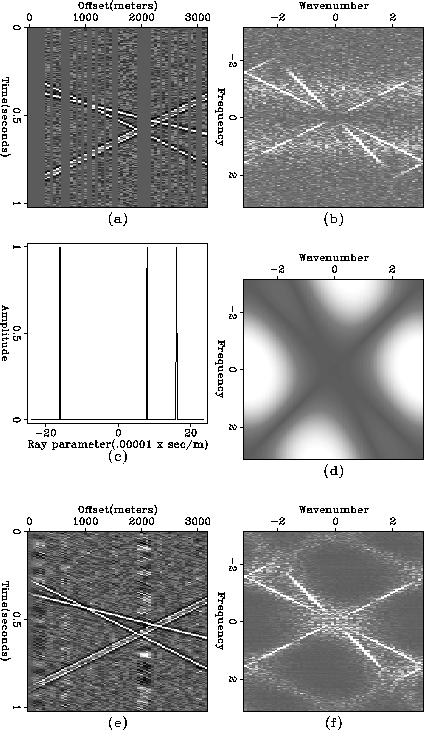
Figure ![[*]](http://sepwww.stanford.edu/latex2html/cross_ref_motif.gif) a and b show a synthetic data set which
contains three linear events and its spectrum, respectively.
From the slant stack of the data, the dip spectrum shown in
Figure c was
obtained by cuttting the noisy low amplitude portion followed by
smoothing after picking the maximum absolute values along the
a and b show a synthetic data set which
contains three linear events and its spectrum, respectively.
From the slant stack of the data, the dip spectrum shown in
Figure c was
obtained by cuttting the noisy low amplitude portion followed by
smoothing after picking the maximum absolute values along the  for each
ray parameter.
The prediction-error filter is generated by putting zeros along the dips picked
and its spectrum, shown in Figure d.
The interpolated result, Figure e, shows quite well aligned linear
events and the spectrum after interpolation, Figure f, shows no more
aliasing.
for each
ray parameter.
The prediction-error filter is generated by putting zeros along the dips picked
and its spectrum, shown in Figure d.
The interpolated result, Figure e, shows quite well aligned linear
events and the spectrum after interpolation, Figure f, shows no more
aliasing.
For testing the applicability to noisy data, random noise with the
amplitude of .2 times of signal amplitude was added to the
synthetic data set shown in Figure a.
Figure a and b show such a synthetic data and its spectrum.
After interpolation, Figure e shows a good interpolation except that
noises are also interpolated along the picked dips.
Figure f shows the spectrum after interpolation and it shows clearly
the effect to the noises.
But this artifact does not cause a serious problem because the noise level
is relatively low and noises are only locally interpolated.
synlace
Figure 1 (a) A synthetic data set with three dipping events
(b) the spectrum of the synthetic data set
(c) The dips picked from slant stack
(d) the spectrum of the prediction-error filters
(e) The interlaced data set
(f) the spectrum of the interlaced data set
 synlacewn
Figure 2 (a) A synthetic data set with three dipping events and additional noise
(b) the spectrum of the synthetic data set
(c) The dips picked from slant stack
(d) the spectrum of the prediction-error filters
(e) The interlaced data set
(f) the spectrum of the interlaced data set
Figure a shows a synthetic data set which contains
several linear events
with some background noise and 50 percent of the traces are randomly
missing.
For this case, again, the dip spectrum picks three dominant dips as in the
interlacing case.
Since there are fewer constraints in the region of more missing traces,
the convergence of this model is a little bit slower than
that of the interlacing case.
The result of interpolation, Figure e, shows quite good interpolation
along the given dips except that the noise region tends to line up
along the dip.
But the amplitude of the noise is relatively low and does not
affect the spectrum too much.
synmisswn
Figure 3 (a) A synthetic data set with randomly missing traces
( 50 percent of total traces are missing )
(b) the spectrum of the synthetic data set
(c) The dips picked from slant stack
(d) the spectrum of the filter simulated
(e) The interpolated data set
(f) the spectrum of the interpolated data set
Next: Real data
Up: NUMERICAL EXAMPLES
Previous: NUMERICAL EXAMPLES
Stanford Exploration Project
11/18/1997