

Next: REGRIDDING IRREGULARLY SAMPLED TRACES
Up: NUMERICAL EXAMPLES
Previous: Synthetic data
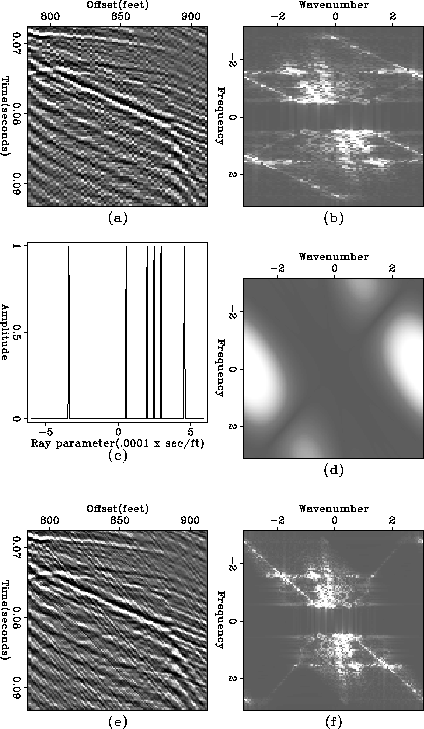
In Figure ![[*]](http://sepwww.stanford.edu/latex2html/cross_ref_motif.gif) a, a crosswell data set has been windowed,
to provide a small test data set and subsampled using
a, a crosswell data set has been windowed,
to provide a small test data set and subsampled using  .The result of interpolation from the subsampled version is shown in
Figure
 ![[*]](http://sepwww.stanford.edu/latex2html/cross_ref_motif.gif) e.
For comparison between the original and interpolated,
Figure
e.
For comparison between the original and interpolated,
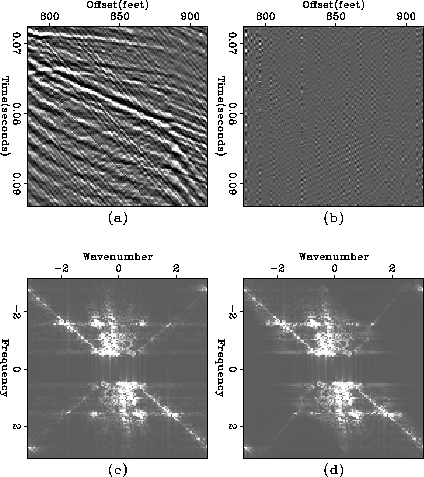
Figure ![[*]](http://sepwww.stanford.edu/latex2html/cross_ref_motif.gif) shows
the original data set before subsampling and the difference with the
interpolated.
Figure
shows
the original data set before subsampling and the difference with the
interpolated.
Figure ![[*]](http://sepwww.stanford.edu/latex2html/cross_ref_motif.gif) c and
c and ![[*]](http://sepwww.stanford.edu/latex2html/cross_ref_motif.gif) d are the spectrum of the original data and
of the interpolated from the subsampled version.
These show almost the same pattern except that a positive dip event
is very weakly interpolated, but this is because the positive dip component
in the spectrum of the subsampled data set is very weak.
cwlace
d are the spectrum of the original data and
of the interpolated from the subsampled version.
These show almost the same pattern except that a positive dip event
is very weakly interpolated, but this is because the positive dip component
in the spectrum of the subsampled data set is very weak.
cwlace
Figure 4 (a) A real crosswell data set which is subsampled with 2 feet sampling intervalfrom Figure 6a where sampling interval is 1 foot.
(b) the spectrum of the crosswell data set
(c) the dips picked from slant stack
(d) the spectrum of the prediction-error filters
(e) the interlaced data set ( sampling interval is 1 foot )
(f) the spectrum of the interlaced data set.
 cwlacediff
Figure 5 (a) A real crosswell data set
(b) the difference between the original data and interpolated data set ( = Figure 6a - Figure 5e )
(c) the spectrum of the original data
(d) the spectrum of the interpolated data set from the subsampled version.


Next: REGRIDDING IRREGULARLY SAMPLED TRACES
Up: NUMERICAL EXAMPLES
Previous: Synthetic data
Stanford Exploration Project
11/18/1997

![[*]](http://sepwww.stanford.edu/latex2html/cross_ref_motif.gif) a, a crosswell data set has been windowed,
to provide a small test data set and subsampled using
a, a crosswell data set has been windowed,
to provide a small test data set and subsampled using 