 |
Figure 4
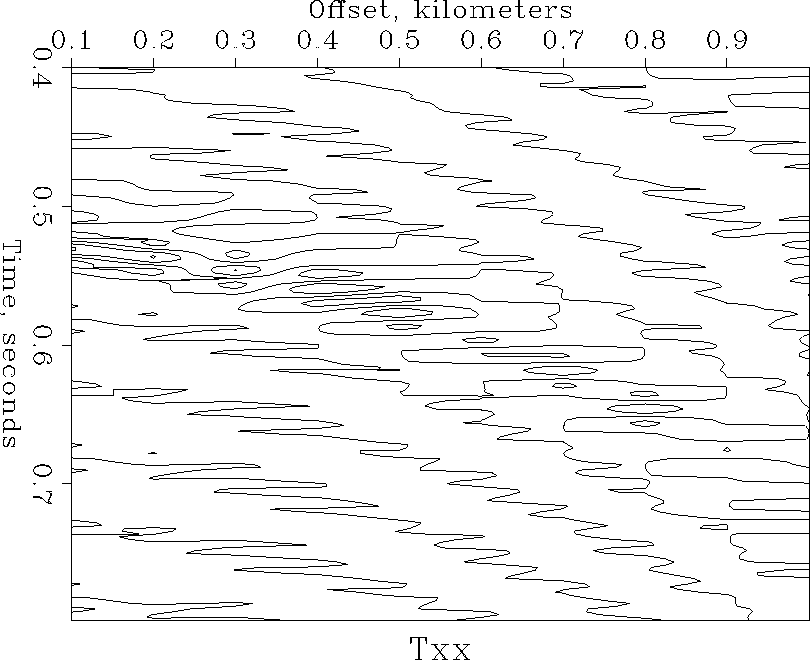
Contour < Txx\_Windowed.H par=plotpar | Pspen
Contour < Txx_Windowed.H par=plotpar | TubeFigure
![[*]](http://sepwww.stanford.edu/latex2html/cross_ref_motif.gif) shows the result.
shows the result.
 |
Contour < Txx\_Windowed.H par=plotpar | Pspen
``Ta2vplot'' is a different kind of plotting program;
it plots byte-deep rasters (esize=1).
Since the data in Txx.H is floating-point (esize=4),
we have to plot using two steps:
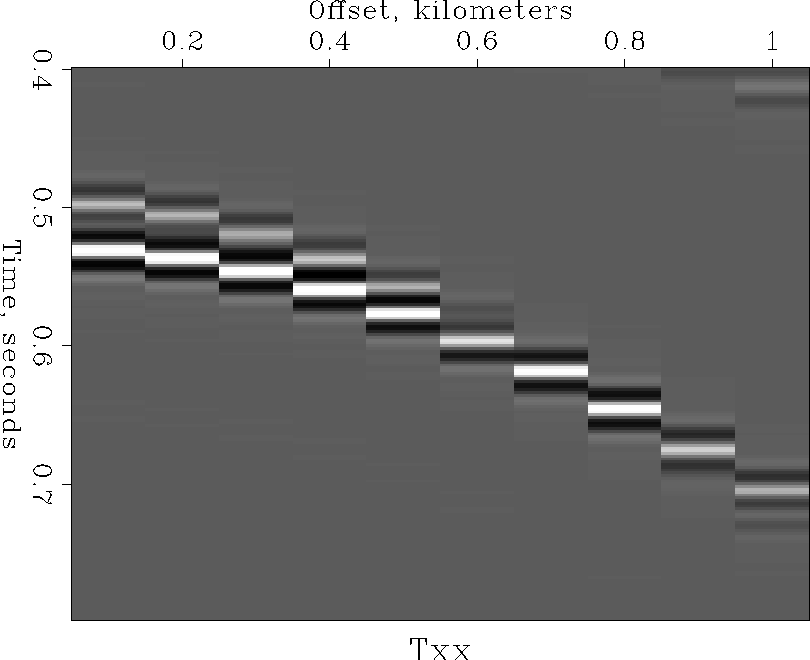
Byte < Txx_Windowed.H pclip=100 | Ta2vplot par=plotpar | TubeThe program ``
Byte'' converts from floats to bytes,
and then Ta2vplot plots the bytes as grey-scale rasters.
Figure ![[*]](http://sepwww.stanford.edu/latex2html/cross_ref_motif.gif) shows the
shows the Ta2vplot version of our
zoomed-in Wiggle and Contour plot.
(Note that the rasters
are centered on their associated ``Offset'' value.)
 |
Byte < Txx\_Windowed.H pclip=100 | Ta2vplot par=plotpar | Pspen