 |
Figure 1 A portion of a three-component crosshole record.
 |
We would like to rotate these data to a coordinate system where the P and SV particle motion directions lie along two of the axes. Such a rotation separates the two events and could also reveal SH wave energy, having a particle motion perpendicular to both P and SV.
The transformation from X, Y, and Z components to P, SV, and SH wavetypes is described by the equation:
 |
(1) |
We need to know ![]() and
and ![]() for each receiver
in order to perform the rotation. To compute
them, we rotate a small window of data
(centered around one of the events)
using all possible combinations
of the two angles.
Then we select the combination of angles that maximizes the power
of the appropriate wavetype after rotation.
for each receiver
in order to perform the rotation. To compute
them, we rotate a small window of data
(centered around one of the events)
using all possible combinations
of the two angles.
Then we select the combination of angles that maximizes the power
of the appropriate wavetype after rotation.
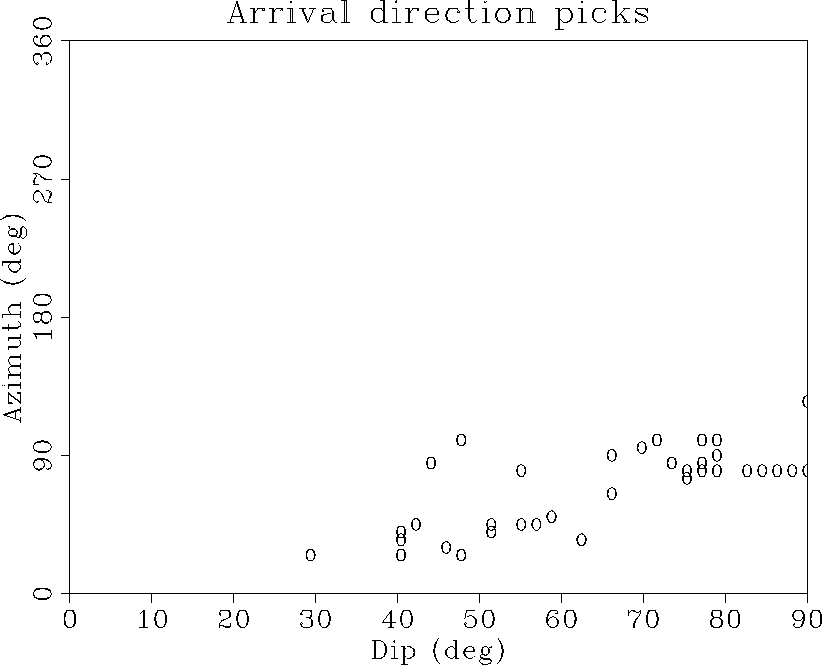
Figure 2 shows the arrival direction picks for the P event. Since this is a crosshole experiment, we expect the source-receiver azimuth to be constant. It is generally consistent; the small variations could be due to raypath effects. We expect the dip angle to vary depending on the relative depths of the source and receiver. Without knowing more about the experiment geometry, we can't confirm that the observed dip angles are reasonable.
 |
Figure 3 shows the data from Figure 1 after rotation using the picked arrival directions. We have done a pretty good job of separating the P and SV events. Unfortunately the SH section doesn't seem to show any SH events, only residual energy left after rotation.
 |