

Next: Residual profile migration
Up: EXPERIMENTS
Previous: EXPERIMENTS
Using the finite-difference algorithm described in this paper,
I calculate the kinematic residual-migration operators that convert
a common shot profile migrated with a initial constant velocity to a
common shot profile migrated with a new constant velocity.
I assume that the operators are known at the bottom of the model,
and use them as the initial solutions. The partial differential
equations are solved from the bottom of the model to the top of the model.
I also assume that all the partial derivatives of traveltimes are calculated
precisely.
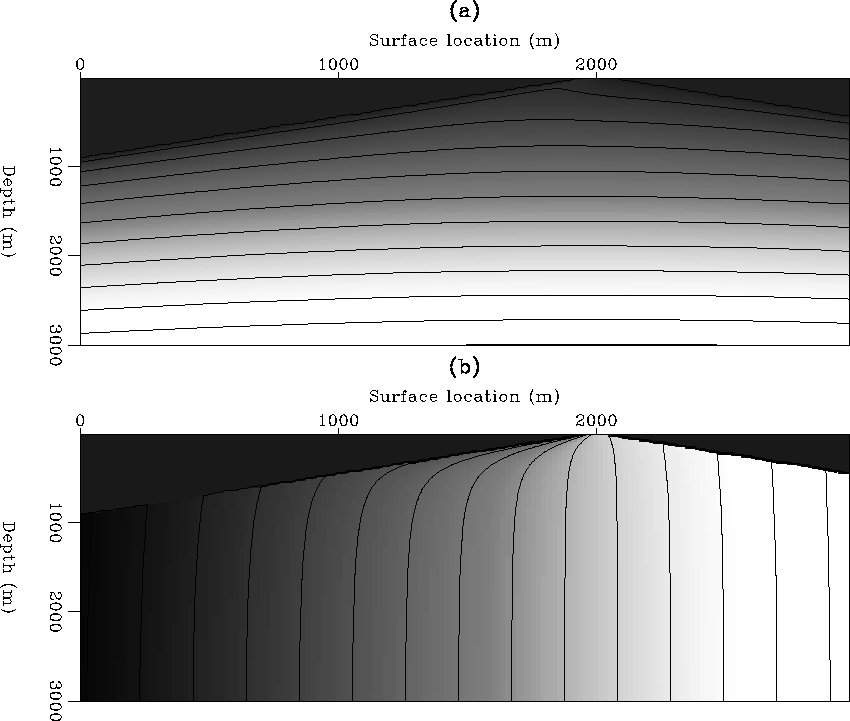
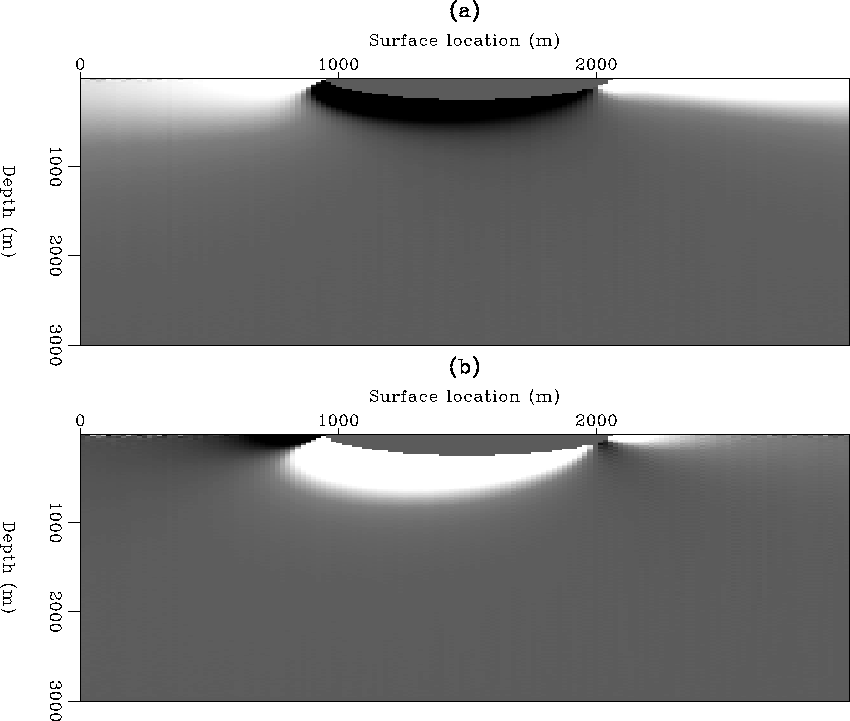
For fixed shot and receiver positions, the operators define a mapping
between  and (x,z). Figures 1 and
2 show
  and
and  as the functions of z and x.
The initial velocity is 1.8 km/s for Figure 1 and
2.2 km/s for Figure 2. The new velocity
is 2 km/s for both cases. The grid is evenly sampled in depth and laterally,
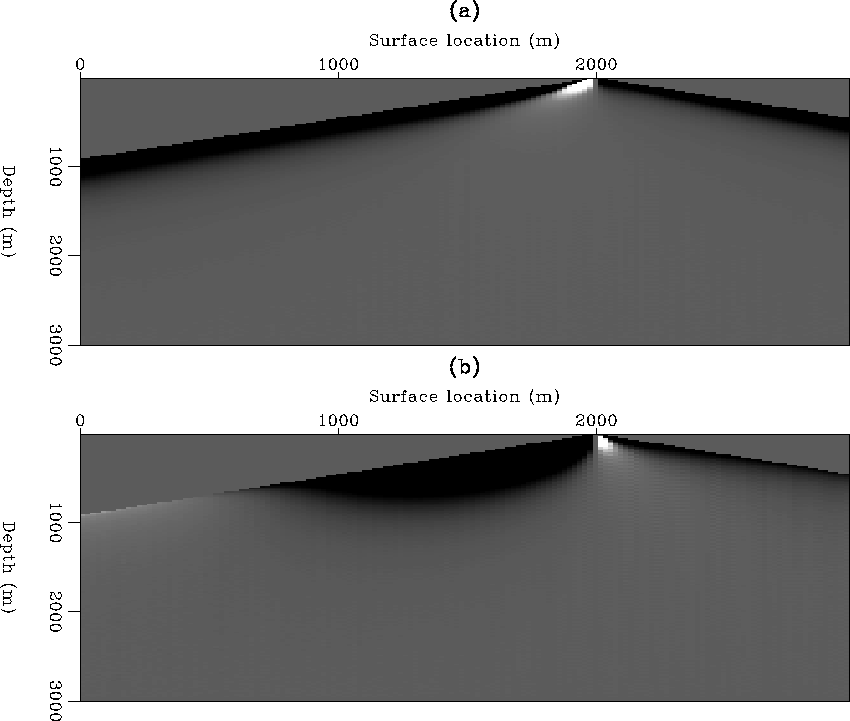
with a sampling interval of 20 m. Figures 3
and 4 display the differences between
these computed functions and the analytical solutions.
We see that the errors are concentrated in the transition regions where
 changes from positive to negative.
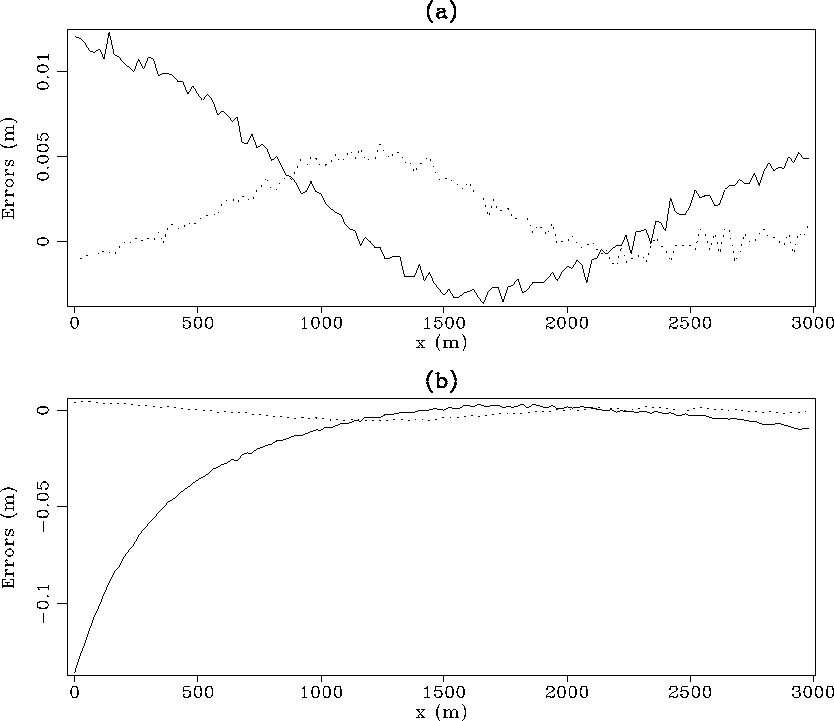
In Figure 5,
I plot the errors at the depth of 1.2 km, as
functions of the horizontal axis. The maximum error at this depth is about two order of
magnitude smaller than the spatial sampling-intervals.
fdzxmap1
Figure 1 Residual profile migration operators computed by the
finite-difference algorithm: (a)  as function of x and z;
(b)
  as function of x and z. The shot is at surface location
1 km, and the receiver is at surface location 2 km.
The ratio between the initial velocity and new velocity is 0.9.
The functions are displayed by both intensity and contour. Low intensity
represents large values of the functions. Contour lines are drawn at 0.28 km
intervals for
  , and 0.15 km intervals for
  .
.
 fdzxmap2
Figure 2 Residual profile migration operators computed by the
finite-difference algorithm: (a)  as function of x and z;
(b)
  as function of x and z. The shot is at surface location
1 km, and the receiver is at surface location 2 km.
The ratio between the initial velocity and new velocity is 1.1.
The functions are displayed by both intensity and contour. Low intensity
represents large values of the functions. Contour lines are drawn at 0.3 km
intervals for
  , and 0.25 km intervals for
  .
.
 anfdzxmap1
Figure 3 Differences between the functions shown in
Figure 1 and the analytical solutions:
(a) difference of  ; (b) difference of
  .
.
 anfdzxmap2
Figure 4 Differences between the functions shown in
Figure 2 and the analytical solutions:
(a) difference of  ; (b) difference of
  .
.
 errslice
Figure 5 Errors of the calculated residual-migration operators
at depth 1.2 km: (a) the ratio between the initial velocity and new velocity
is 0.9; (b) the ratio between the initial velocity and new velocity is 1.1.
The solid lines represent  -functions, and dotted lines represent
 -functions.


Next: Residual profile migration
Up: EXPERIMENTS
Previous: EXPERIMENTS
Stanford Exploration Project
1/13/1998
![]() and (x,z). Figures 1 and
2 show
and (x,z). Figures 1 and
2 show ![]() and
and ![]() as the functions of z and x.
The initial velocity is 1.8 km/s for Figure 1 and
2.2 km/s for Figure 2. The new velocity
is 2 km/s for both cases. The grid is evenly sampled in depth and laterally,
with a sampling interval of 20 m. Figures 3
and 4 display the differences between
these computed functions and the analytical solutions.
We see that the errors are concentrated in the transition regions where
as the functions of z and x.
The initial velocity is 1.8 km/s for Figure 1 and
2.2 km/s for Figure 2. The new velocity
is 2 km/s for both cases. The grid is evenly sampled in depth and laterally,
with a sampling interval of 20 m. Figures 3
and 4 display the differences between
these computed functions and the analytical solutions.
We see that the errors are concentrated in the transition regions where
![]() changes from positive to negative.
In Figure 5,
I plot the errors at the depth of 1.2 km, as
functions of the horizontal axis. The maximum error at this depth is about two order of
magnitude smaller than the spatial sampling-intervals.
changes from positive to negative.
In Figure 5,
I plot the errors at the depth of 1.2 km, as
functions of the horizontal axis. The maximum error at this depth is about two order of
magnitude smaller than the spatial sampling-intervals.


