|
|
|
|
Short note: Three dimensional deconvolution of helioseismic data |
When using too low an ![]() value (or none at all) then a lot of low frequency noise was visible in the deconvolved image and this energy dominated any smaller events. When using
value (or none at all) then a lot of low frequency noise was visible in the deconvolved image and this energy dominated any smaller events. When using
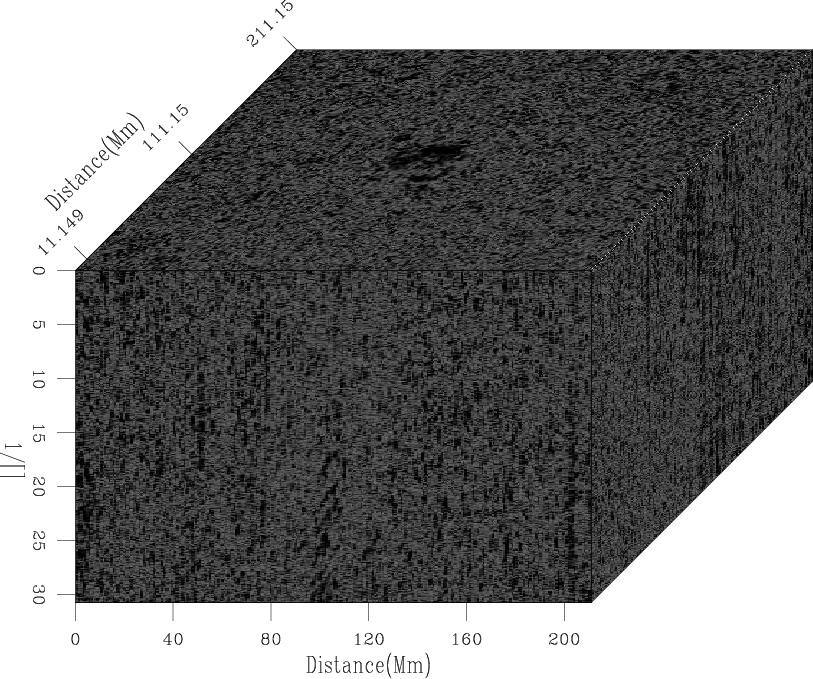
![]() Figure 3 is produced. This initial deconvolved image is noisy and no discernible areas of high amplitude contrast are noticeable, with the exception of the sun spot, as was visible in the raw data. A potential conclusion from this is that source regions are too poorly separated in time and space to be visible, or that all shallow source regions operate at a similar power giving no conclusive separations after deconvolution.
Figure 3 is produced. This initial deconvolved image is noisy and no discernible areas of high amplitude contrast are noticeable, with the exception of the sun spot, as was visible in the raw data. A potential conclusion from this is that source regions are too poorly separated in time and space to be visible, or that all shallow source regions operate at a similar power giving no conclusive separations after deconvolution.
|
|---|
|
decon
Figure 3. The deconvolved data. |
|
|
The next stage for this concept will be to further tune ![]() and experiment with smaller sections of the data and also to test with balancing the data and the impulse response. One way could be to window the impulse response and use a smaller section for the deconvolution, and also to focus on smaller time windows.
and experiment with smaller sections of the data and also to test with balancing the data and the impulse response. One way could be to window the impulse response and use a smaller section for the deconvolution, and also to focus on smaller time windows.
|
|
|
|
Short note: Three dimensional deconvolution of helioseismic data |