|
|
|
|
Seismic tests at Southern Ute Nation coal fire site |
|
|---|
|
inter-001-ann
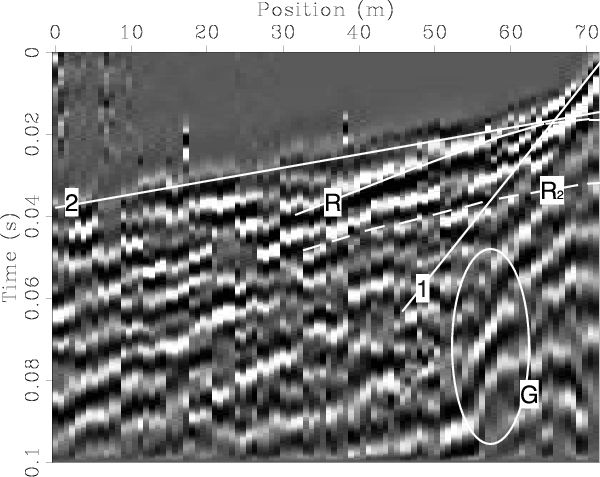
Figure 9. Line 1, shot at southwestern end, 10 m SW of well #11. A possible reflection, annotated |
|
|
|
|---|
|
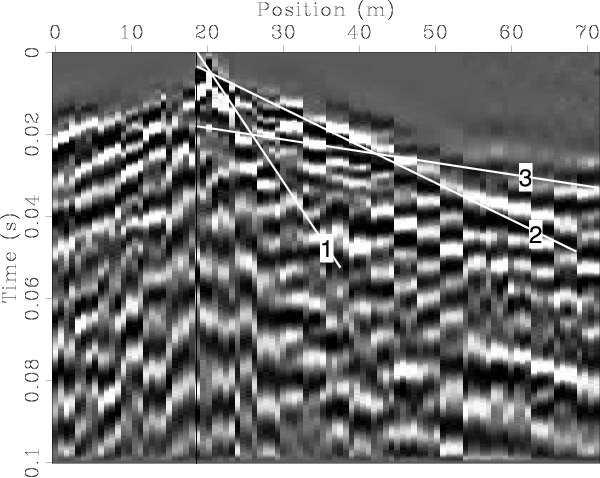
inter-018-ann
Figure 10. Line 1, shot on sandstone outcrop, in the road. A direct P-wave event annotated |
|
|
We performed simple refraction analyses to estimate a velocity profile (Stein and Wysession, 2003). The direct P-wave and two refractions' slopes indicate three velocities: ![]() m/s,
m/s, ![]() m/s and
m/s and ![]() m/s. These are relatively consistent for both figures, although errors in the range of 30% are possible. The intersection times in Figure 9 indicate two layer thicknesses of
m/s. These are relatively consistent for both figures, although errors in the range of 30% are possible. The intersection times in Figure 9 indicate two layer thicknesses of ![]() m and
m and ![]() m. The intersection times in Figure 9 indicate two layer thicknesses of
m. The intersection times in Figure 9 indicate two layer thicknesses of ![]() m and
m and ![]() m. These differences are due both to estimation error and lateral variation of the geology and topography. However, they suggest two positive velocity discontinuities at approximately
m. These differences are due both to estimation error and lateral variation of the geology and topography. However, they suggest two positive velocity discontinuities at approximately ![]() m and
m and ![]() m. Comparing these depths to the log shown in Figure 11 (depth indicated in feet), suggests that they are not as deep as the coal and could be associated with the top of the thick sandstone bed. Perhaps the thin sandstone bed in the shale, or a positive velocity gradient in the shale, is the reflector. The intersection time of the reflection is approximately
m. Comparing these depths to the log shown in Figure 11 (depth indicated in feet), suggests that they are not as deep as the coal and could be associated with the top of the thick sandstone bed. Perhaps the thin sandstone bed in the shale, or a positive velocity gradient in the shale, is the reflector. The intersection time of the reflection is approximately ![]() s, using a estimated velocity of
s, using a estimated velocity of ![]() m/s. This would indicate a reflector at approximately
m/s. This would indicate a reflector at approximately ![]() m depth.
m depth.

|
|---|
|
well3
Figure 11. Well log at well #3. Lithology is indicated below, with depth indicated in feet. A |
|
|
The frequency wave-number spectrum in Figure 4 shows significant high wave-number noise. This is partly due to the interleaving technique. The energy associated with reflections, refractions and surface waves is all located and mixed together below wave-numbers of ![]()
![]() and frequencies below
and frequencies below ![]() Hz. This offers little opportunity to filter the refractions and surface waves from the reflection. Applying Normal Move Out (NMO) to flatten the reflector on the shot gather of Figure 6(b) was consistent with the velocity estimates.
Hz. This offers little opportunity to filter the refractions and surface waves from the reflection. Applying Normal Move Out (NMO) to flatten the reflector on the shot gather of Figure 6(b) was consistent with the velocity estimates.
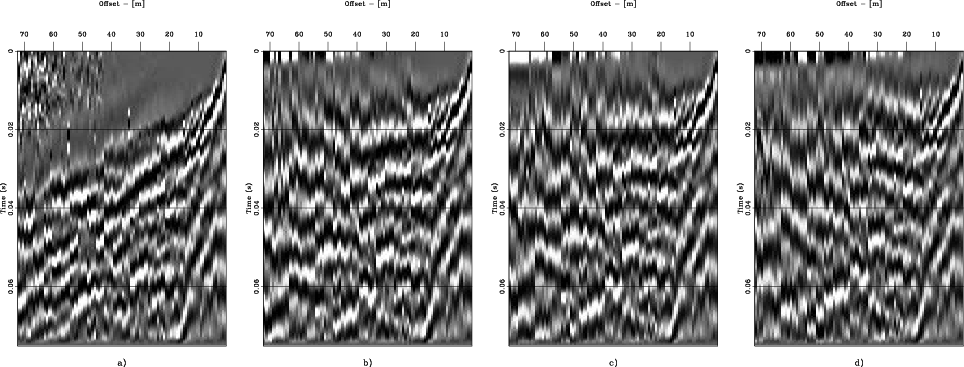
The shot gather after NMO with three different velocities is shown in Figure 12. A NMO velocity of ![]() m/s seems optimal to flatten the flanks of the interpreted reflector. This NMO velocity was tested for consistency with the velocities coming from refraction. Various stacking velocities,
m/s seems optimal to flatten the flanks of the interpreted reflector. This NMO velocity was tested for consistency with the velocities coming from refraction. Various stacking velocities, ![]() , and normal incidence travel times,
, and normal incidence travel times, ![]() , were tested for their equivalent interval velocity,
, were tested for their equivalent interval velocity, ![]() , and layer thicknesses,
, and layer thicknesses, ![]() .
.
| (1) |
Most combinations are fairly sensible, but pushing the lower velocity to ![]() m/s also pushes the slow top layer to
m/s also pushes the slow top layer to ![]() m thick. This result is unrealistic considering our data and field observations. Regardless of exact numbers, it appears that the reflection originates at a depth of approximately
m thick. This result is unrealistic considering our data and field observations. Regardless of exact numbers, it appears that the reflection originates at a depth of approximately 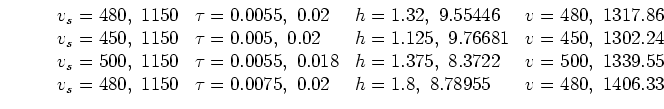 m. Revisiting Figure 9, note a weaker event,
 ![]() , that is possibly a reflection hidden behind the interpreted reflection
, that is possibly a reflection hidden behind the interpreted reflection ![]() . These estimates are rough, but error is unlikely to exceed
. These estimates are rough, but error is unlikely to exceed ![]() %.
%.
|
|---|
|
nmo-fig
Figure 12. Line 1, shot at southwestern end, 10 m SW of well #11. a) No NMO, b) NMO with |
|
|
|
|
|
|
Seismic tests at Southern Ute Nation coal fire site |