|
|
|
|
Seismic tests at Southern Ute Nation coal fire site |
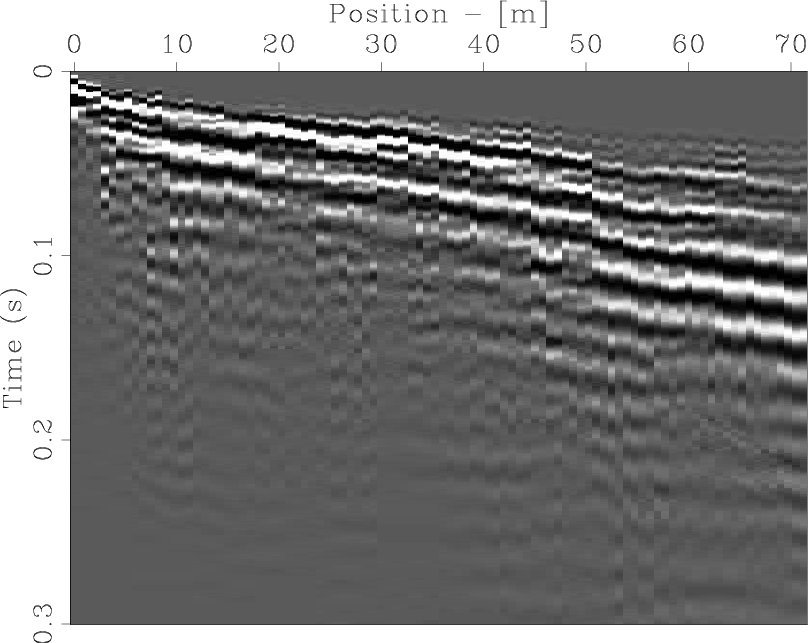
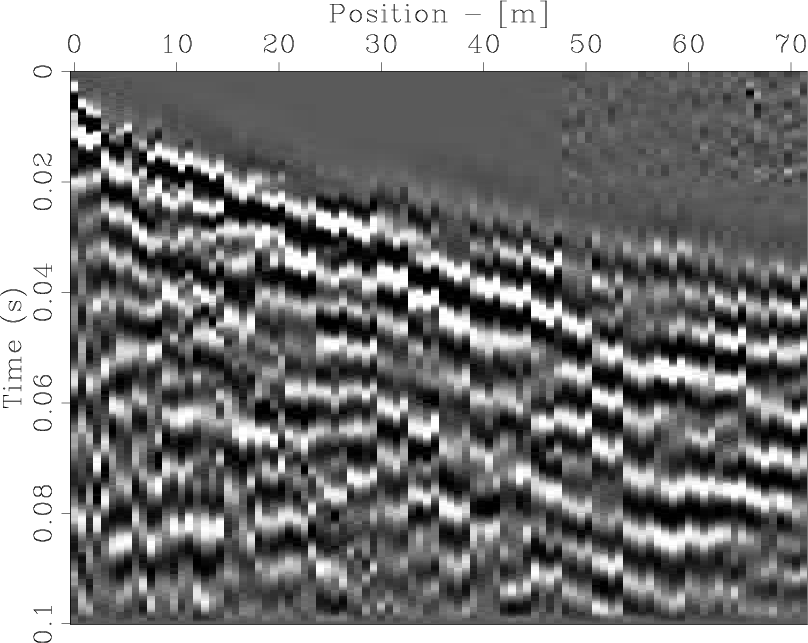
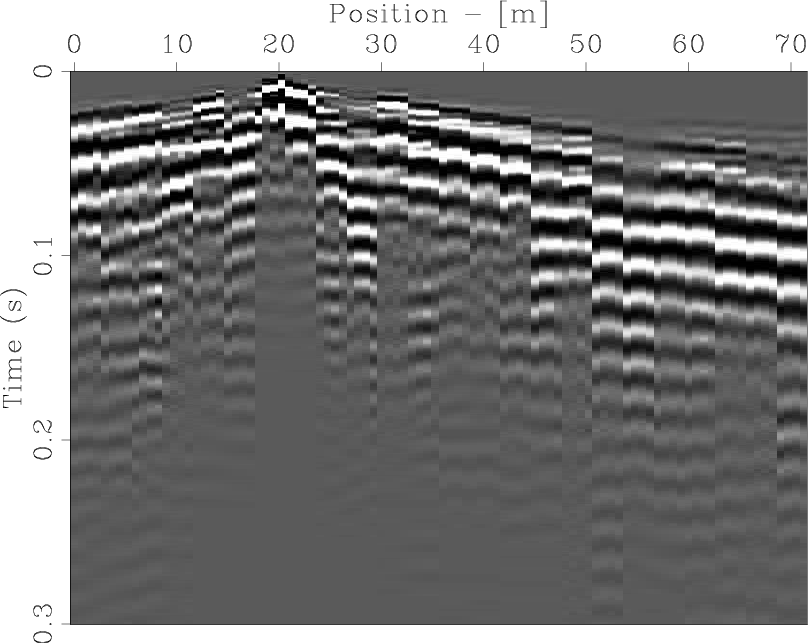
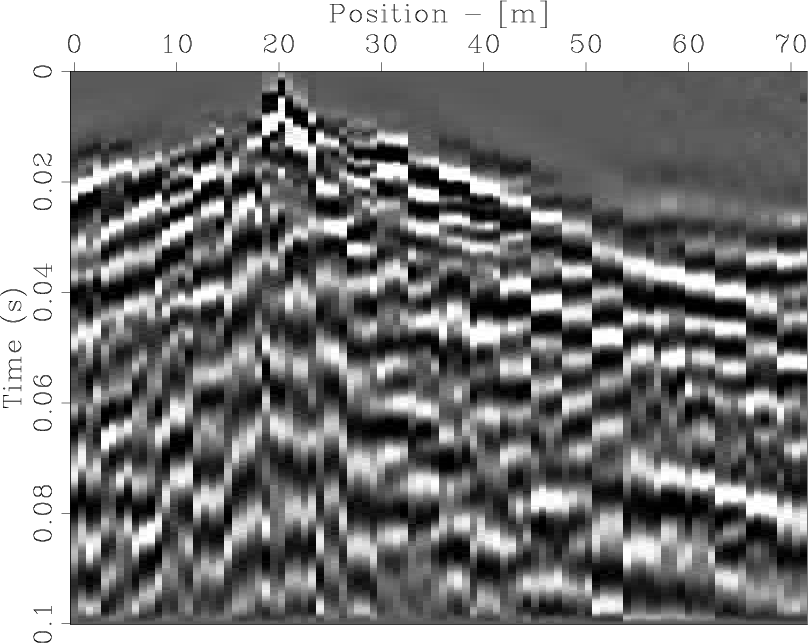
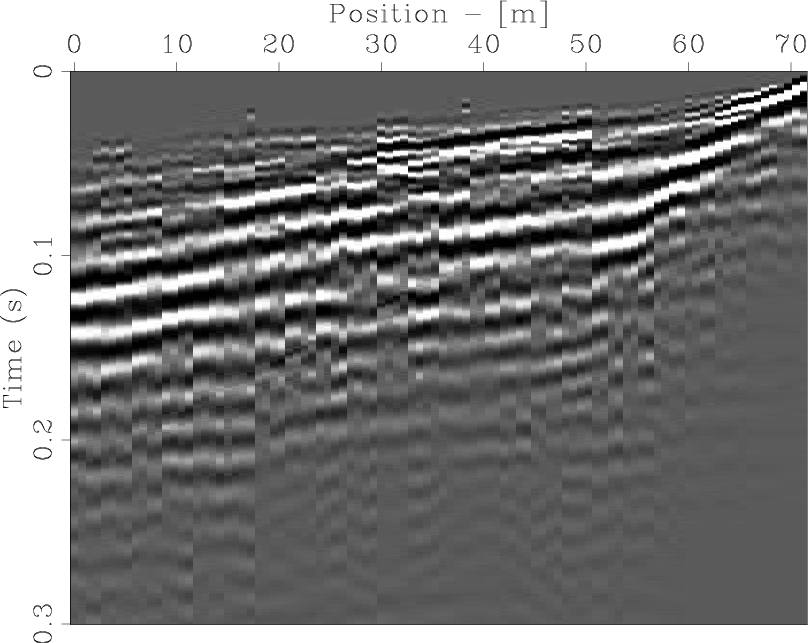
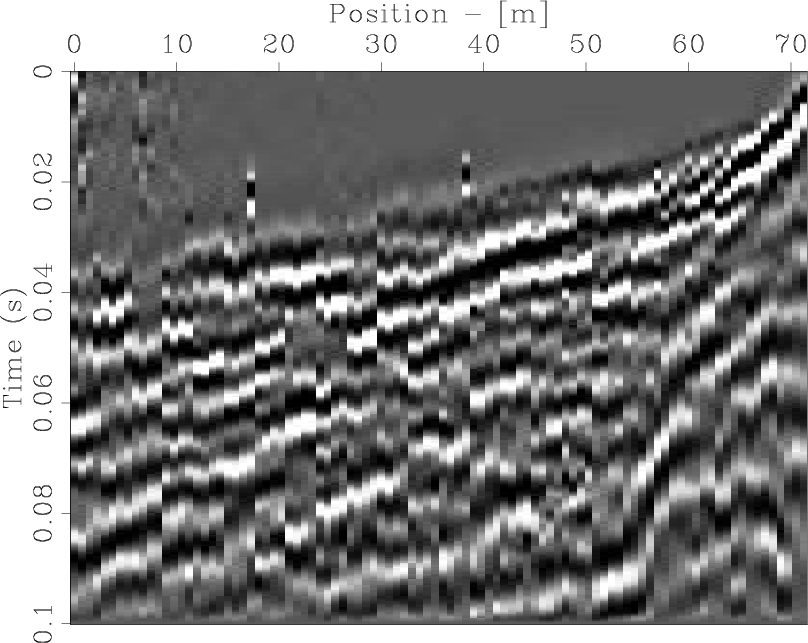
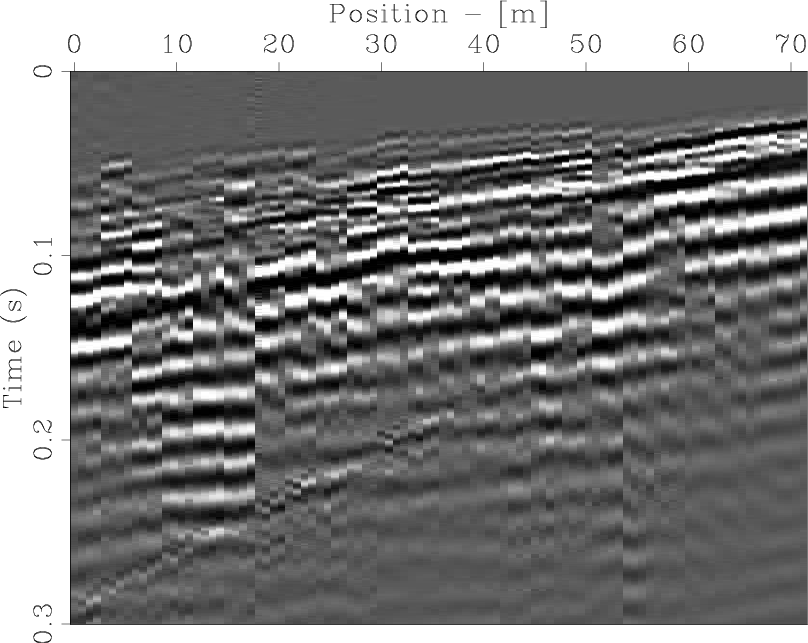
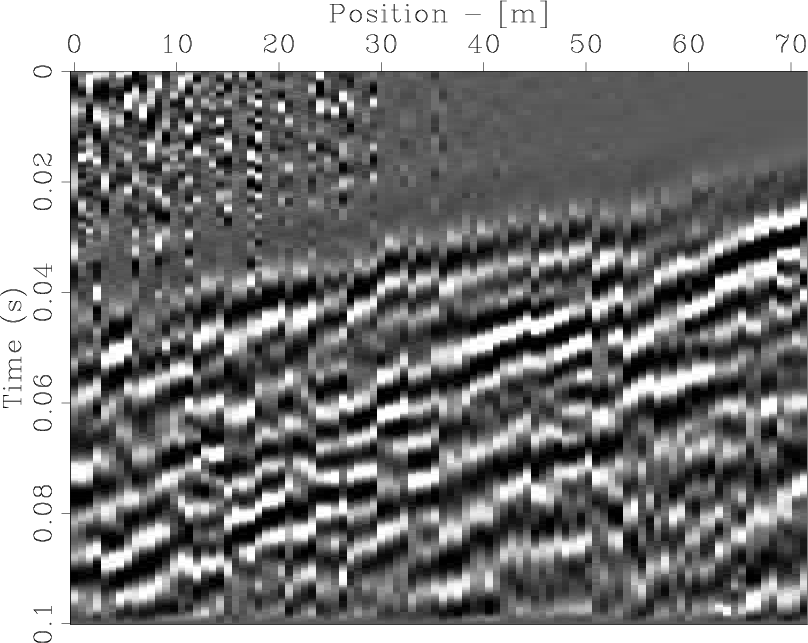
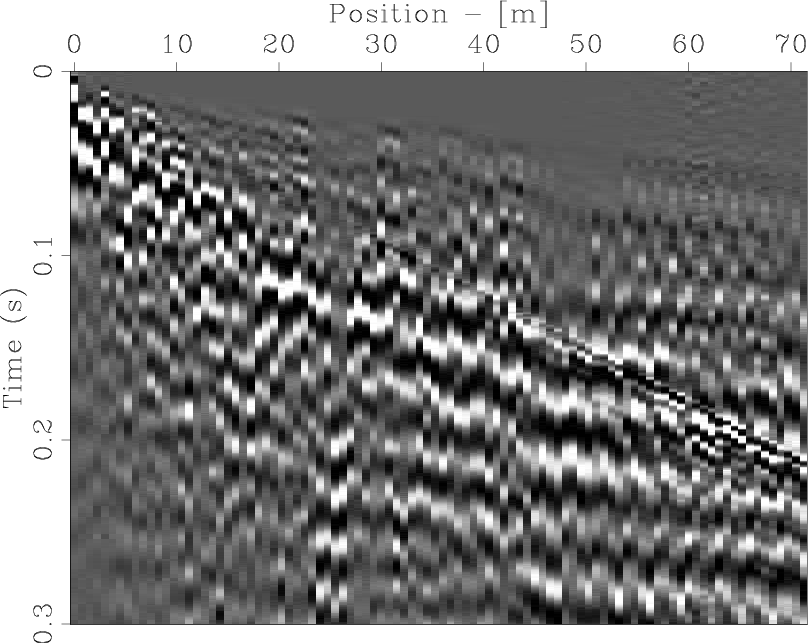
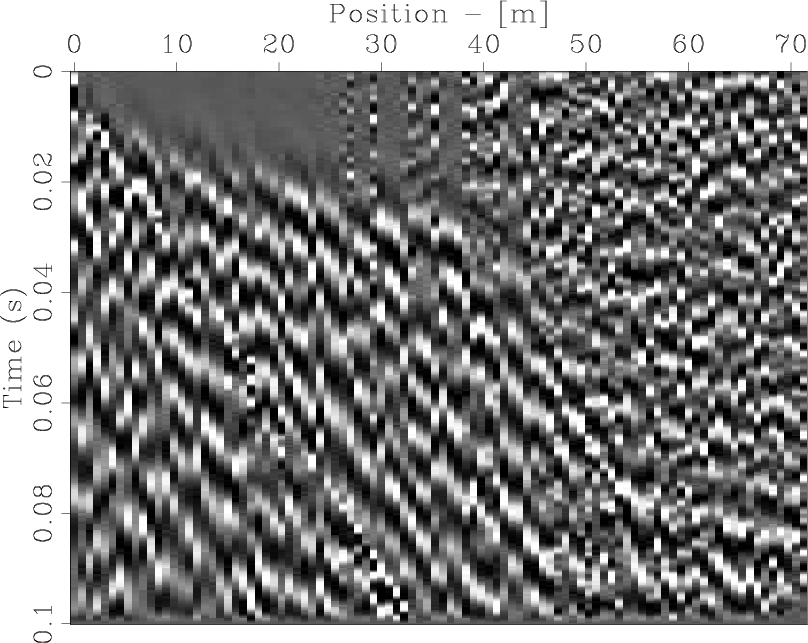
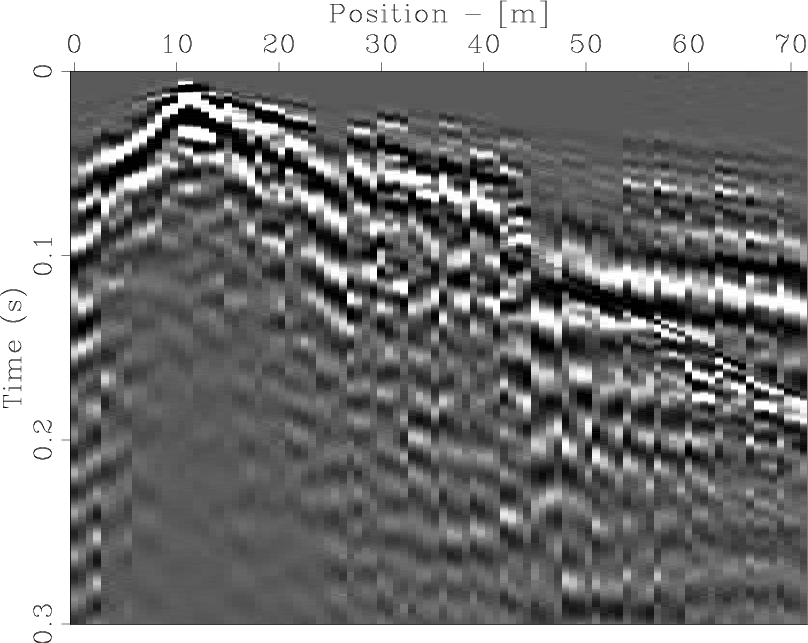
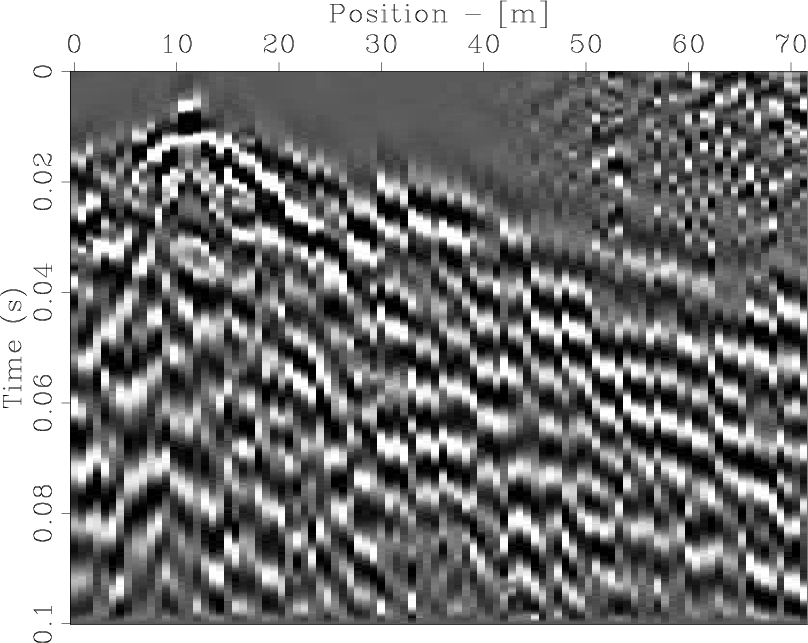
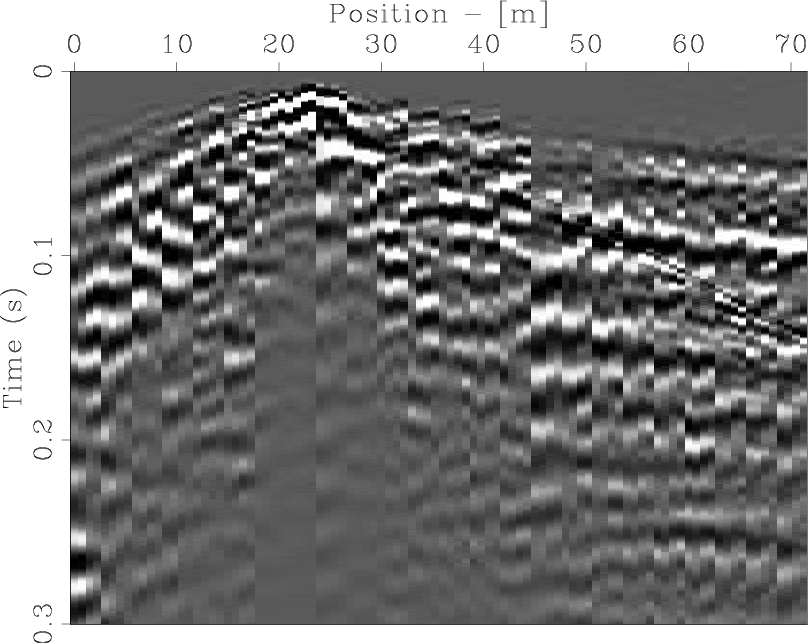
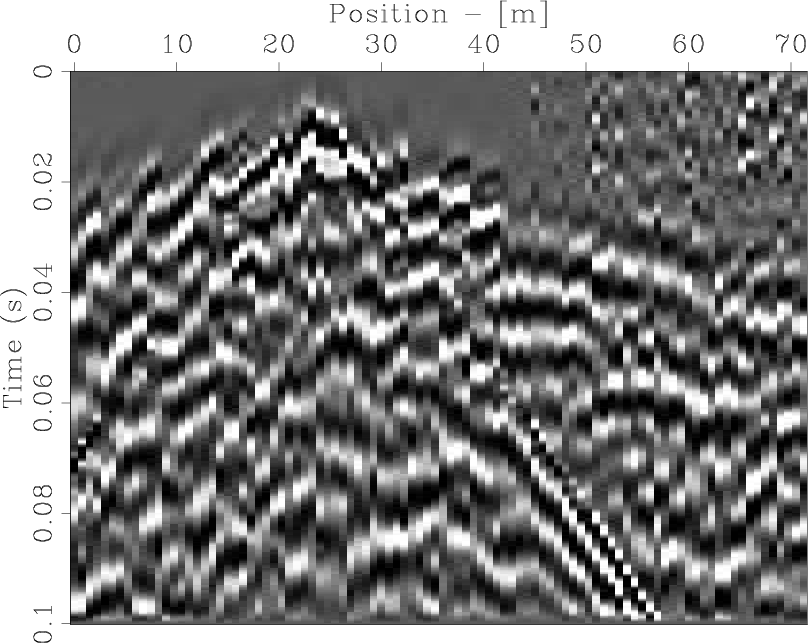
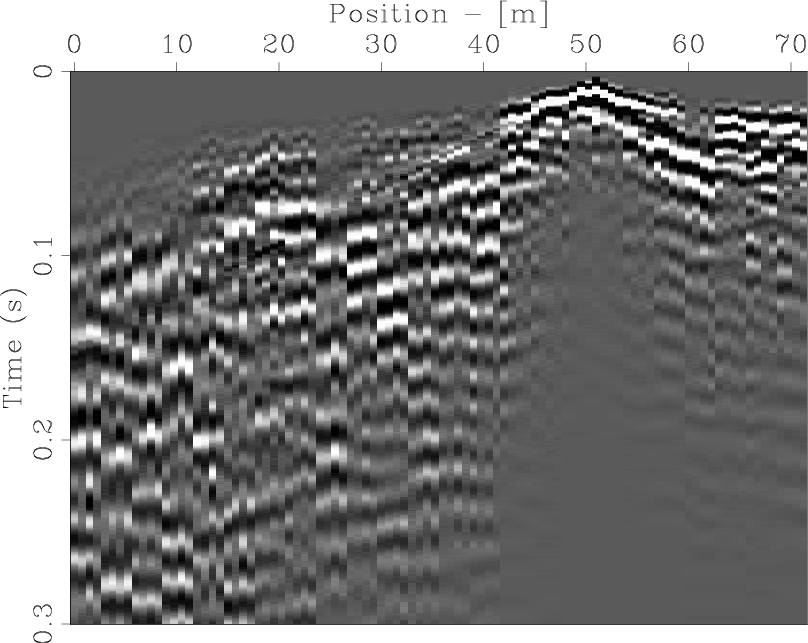
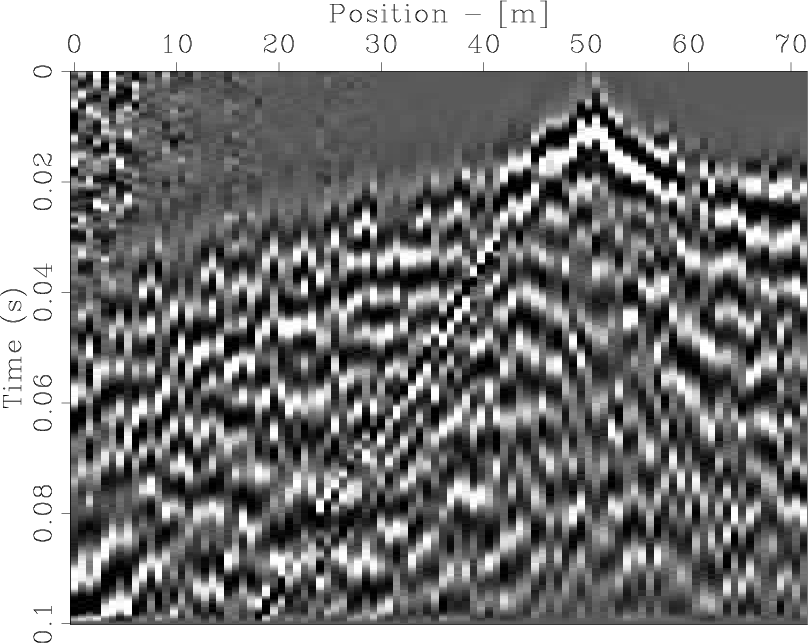
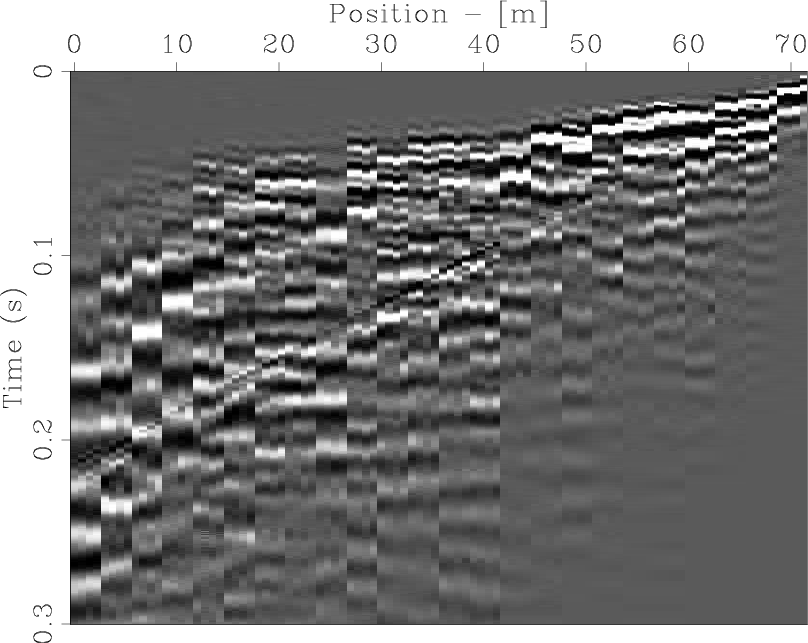
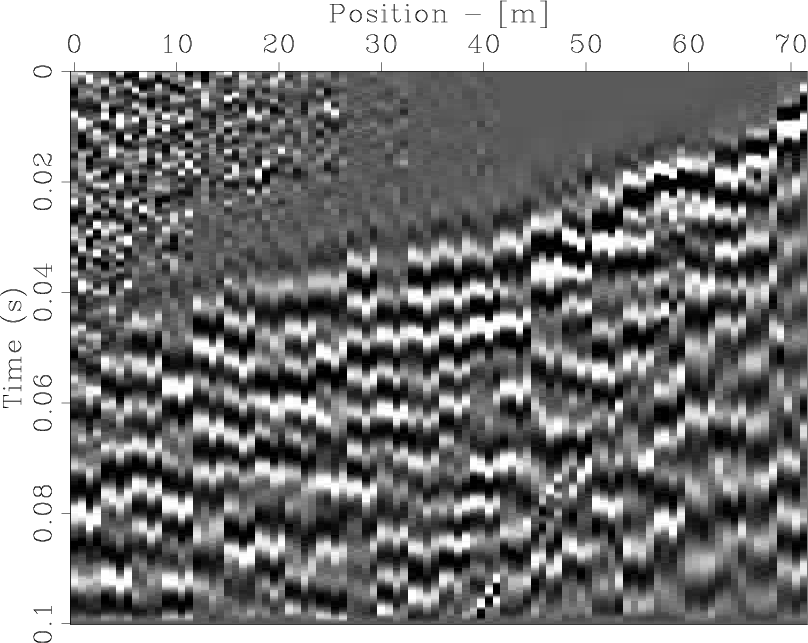
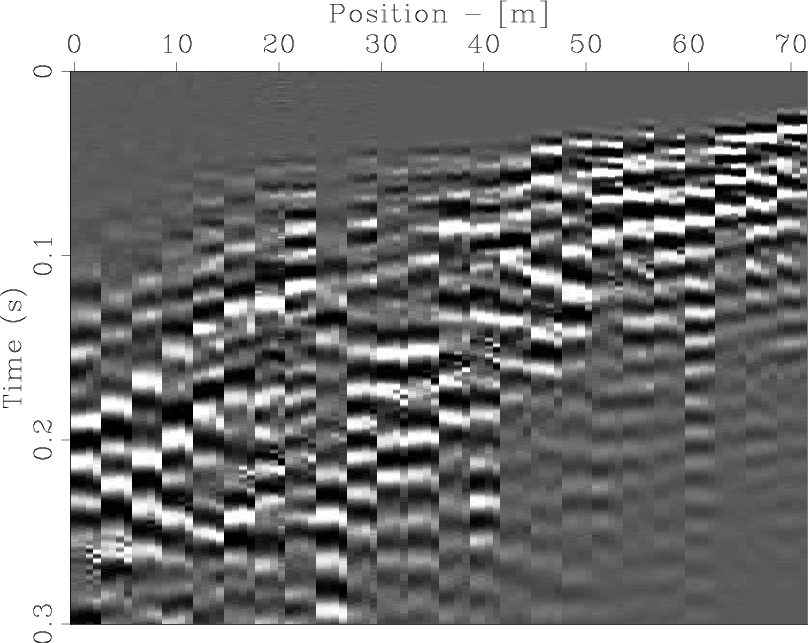
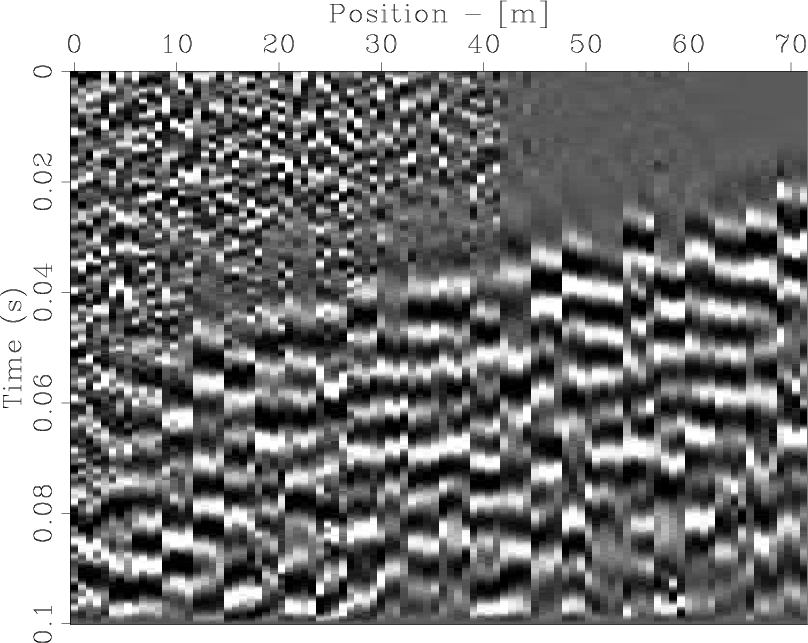
Figures 5(a)-5(f) and 6(a)-6(d) show shot gathers from shots at approximately 0 m, ![]() m,
m, ![]() m,
m, ![]() m and
m and ![]() m, along Line
m, along Line ![]() . For each shot the figures contain a raw data section and a 80-500Hz bandpassed gain controlled section. In general, data quality is good, and strong energy is recorded to at least
. For each shot the figures contain a raw data section and a 80-500Hz bandpassed gain controlled section. In general, data quality is good, and strong energy is recorded to at least ![]() Hz. In some shot gathers, a reflection can be observed. Energy propagates well to the farthest recorded offsets. For all of these line
Hz. In some shot gathers, a reflection can be observed. Energy propagates well to the farthest recorded offsets. For all of these line ![]() data plots, NE is to the left. The interleaving technique for interpolation worked best for the shot gather in Figure 6(c). The shot in Figure 5(c) was recorded on a sandstone outcrop on the road, the data is ringy and the interleaving technique is less successful than for other shots along this line.
data plots, NE is to the left. The interleaving technique for interpolation worked best for the shot gather in Figure 6(c). The shot in Figure 5(c) was recorded on a sandstone outcrop on the road, the data is ringy and the interleaving technique is less successful than for other shots along this line.
|
Fspectra
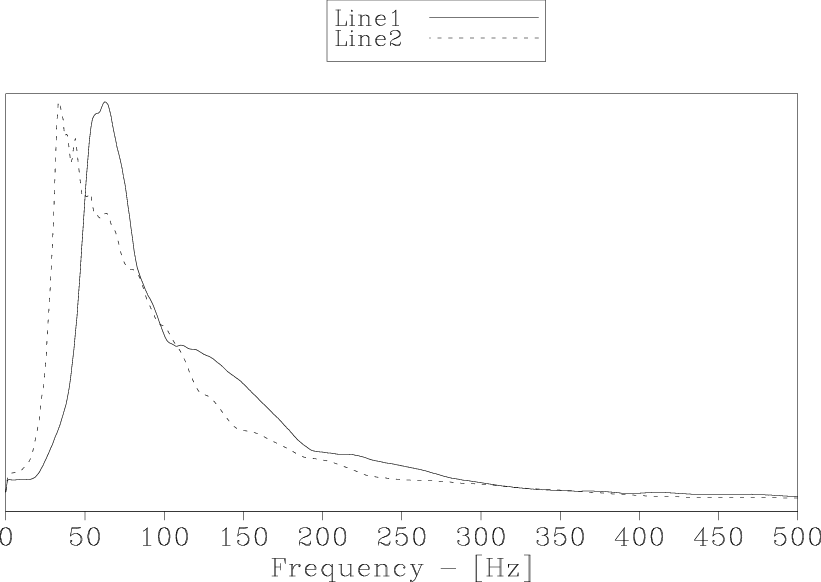
Figure 3. Averaged, normalized spectra of surveys at line 1 and line 2. |
|
|---|---|
|
|
|
FKspectrum
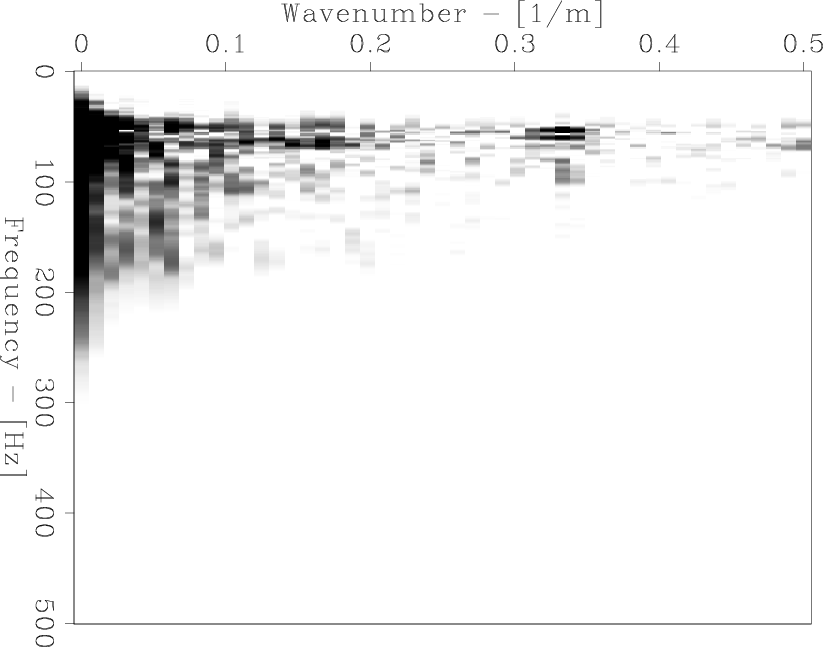
Figure 4. Frequency wave-number spectrum of the shot recorded at Line 1, at |
|
|---|---|
|
|
|
|---|
|
s1-inter-025,s2-inter-025,s1-inter-018,s2-inter-018,s1-inter-009,s2-inter-009
Figure 5. Line 1 shot gathers: a) Raw shot at 0 m, b) shot from (a) 80-500Hz bandpass and AGC and zoom; c) raw shot at |
|
|
|
|---|
|
s1-inter-001,s2-inter-001,s1-inter-0m8,s2-inter-0m8
Figure 6. Line 1 shot gathers: a) Raw shot at |
|
|
|
|---|
|
s1-inter-225,s2-inter-225,s1-inter-221,s2-inter-221,s1-inter-217,s2-inter-217
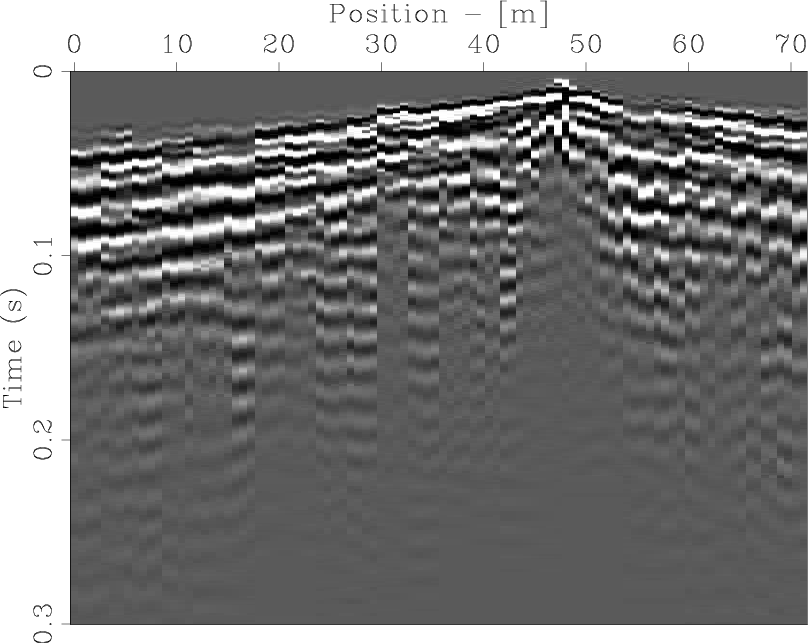
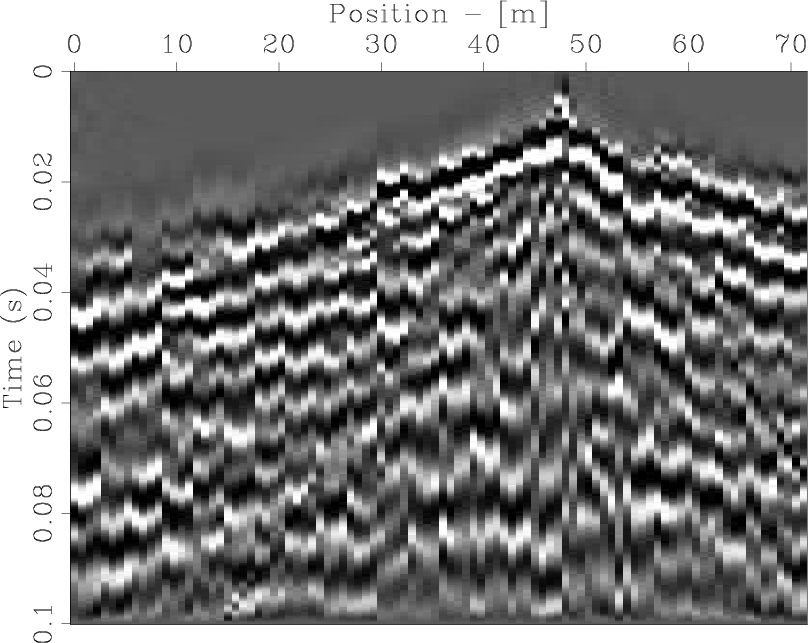
Figure 7. Line 2 shot gathers: a) Raw shot at 0 m, b) shot from (a) 80-500Hz bandpass and AGC and zoom; c) raw shot at |
|
|
|
|---|
|
s1-inter-208,s2-inter-208,s1-inter-201,s2-inter-201,s1-inter-2m5,s2-inter-2m5
Figure 8. Line 2 shot gathers: a) Raw shot at |
|
|
|
|
|
|
Seismic tests at Southern Ute Nation coal fire site |