

Next: conclusion and discussion
Up: Tang: Imaging in the
Previous: selective stacking based on
I tested the method discussed above on the 3-D wide-azimuth version of the SEG/EAGE salt data set.
The wide-azimuth synthetic data was created by Sandia National Laboratory, it has 45 shots in total, with a
shot interval of about 960 meters in both the inline and crossline directions. As can be seen in the plot of the shot layout in
Figure ![[*]](http://sepwww.stanford.edu/latex2html/cross_ref_motif.gif) , most of the shots are regularly spaced, but
some are not. The receiver geometry is a patching geometry, with minimum offset of
about -2000 meters and maximum offset of about 2000 meters in both the inline and crossline directions.
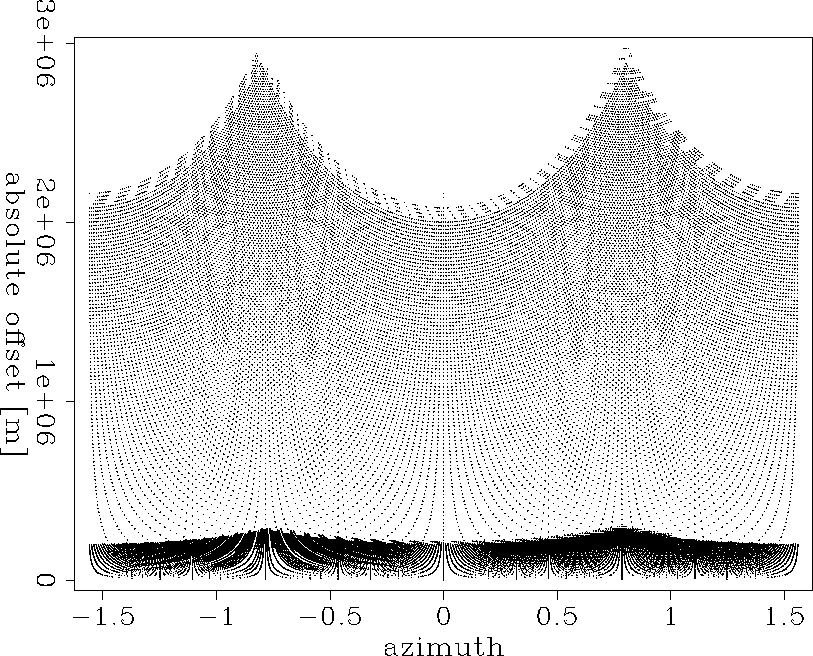
The plot of azimuth versus absolute offset is shown in Figure
, most of the shots are regularly spaced, but
some are not. The receiver geometry is a patching geometry, with minimum offset of
about -2000 meters and maximum offset of about 2000 meters in both the inline and crossline directions.
The plot of azimuth versus absolute offset is shown in Figure ![[*]](http://sepwww.stanford.edu/latex2html/cross_ref_motif.gif) , which illustrates a fairly wide
coverage of azimuth.
, which illustrates a fairly wide
coverage of azimuth.
segsalt.shot.layout
Figure 5 Shot layout. The horizontal axis is inline x, while the vertical axis is crossline y.
Note most of the shots are regularly spaced, but several of them are not.
|
|  |


segsalt.off.azi
Figure 6 Azimuth vs. absolute offset plot. The horizontal axis is azimuth, while the vertical axis is
absolute offset. This data set has very wide azimuth coverage.
|
|  |


The migrated image obtained by using shot-profile migration for all 45 shots is shown in
Figure ![[*]](http://sepwww.stanford.edu/latex2html/cross_ref_motif.gif) . Since there are only 45 shots and they are sparsely distributed,
the SODCIGs and ADCIGs should have significant sampling induced artifacts.
To save disk space and computation cost, the SODCIGs
are not computed for all the image points in the model space; instead,
the output image coordinate is restricted to within [6580, 8480] for the inline direction
and [8460, 9920] for the crossline direction. I computed 25 half-offsets for both the inline and crossline directions
and the spacing of half-local-offset equals 40 meters, twice as much as the receiver spacing, which is 20 meters.
Hence the half-subsurface-offset ranges from -480 meters to 480 meters in both the inline and crossline directions.
. Since there are only 45 shots and they are sparsely distributed,
the SODCIGs and ADCIGs should have significant sampling induced artifacts.
To save disk space and computation cost, the SODCIGs
are not computed for all the image points in the model space; instead,
the output image coordinate is restricted to within [6580, 8480] for the inline direction
and [8460, 9920] for the crossline direction. I computed 25 half-offsets for both the inline and crossline directions
and the spacing of half-local-offset equals 40 meters, twice as much as the receiver spacing, which is 20 meters.
Hence the half-subsurface-offset ranges from -480 meters to 480 meters in both the inline and crossline directions.
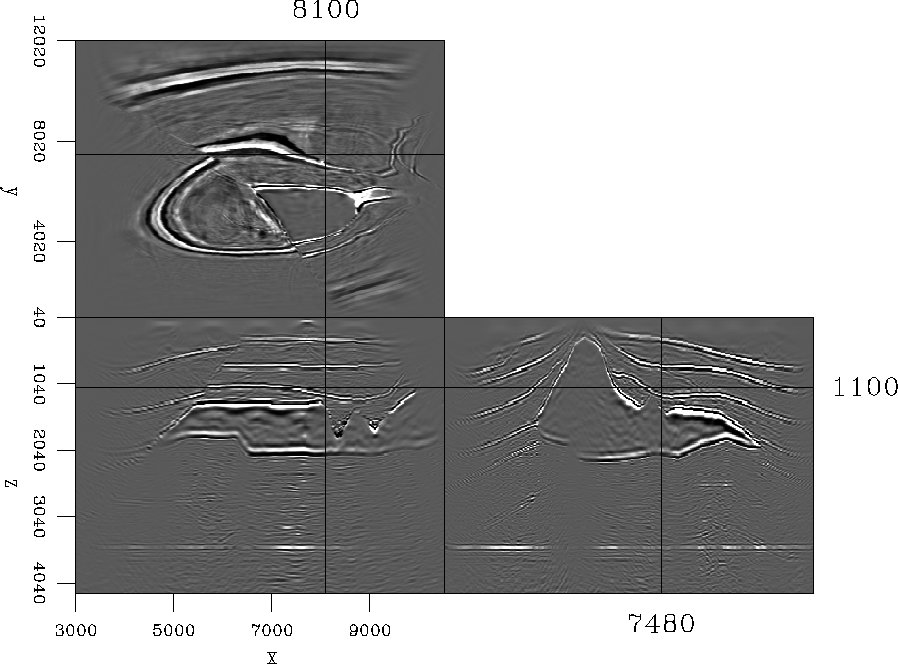
segsalt.img
Figure 7 Shot-profile migration result of all 45 shots.


Figure ![[*]](http://sepwww.stanford.edu/latex2html/cross_ref_motif.gif) shows the migrated image for the particular image size discribed above.
The crosshairs indicate two different surface locations for the output SODCIGs, which are
shown in Figure
shows the migrated image for the particular image size discribed above.
The crosshairs indicate two different surface locations for the output SODCIGs, which are
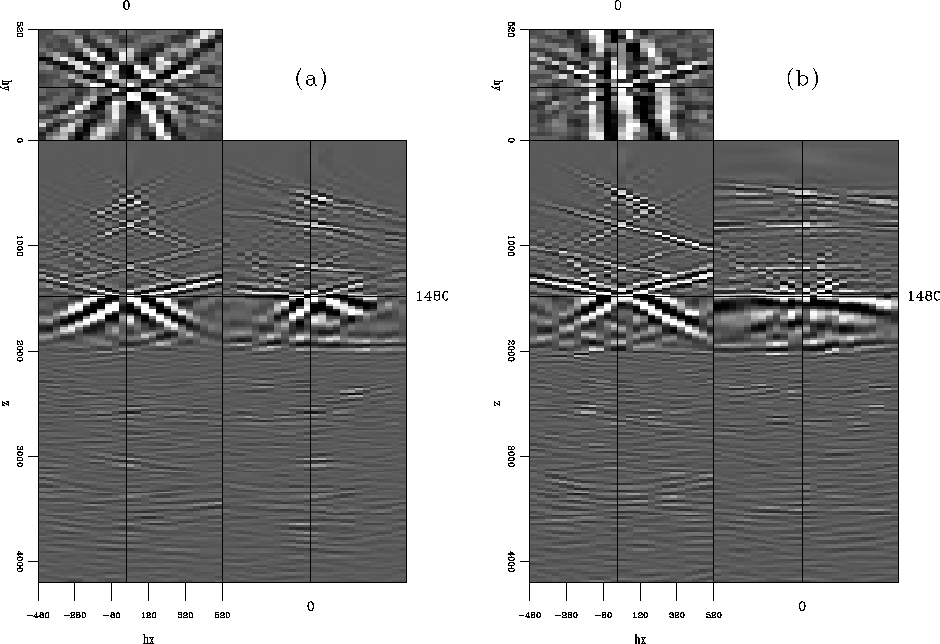
shown in Figure ![[*]](http://sepwww.stanford.edu/latex2html/cross_ref_motif.gif) . From Figure
. From Figure ![[*]](http://sepwww.stanford.edu/latex2html/cross_ref_motif.gif) we can see that
since the correct migration velocity is used, there is some focusing of energy
at zero offset. However, the energy is not well focused because there are only 45 shots, and thus
at most 45 planes intersecting at zero-offset location, which are not sufficient to cancel the
energy at non-zero offsets.
we can see that
since the correct migration velocity is used, there is some focusing of energy
at zero offset. However, the energy is not well focused because there are only 45 shots, and thus
at most 45 planes intersecting at zero-offset location, which are not sufficient to cancel the
energy at non-zero offsets.
Since the sources are extremely sparsely located, and the receiver coverage is limited for each shot, we can identify
some curved events in the SODCIGs in Figure ![[*]](http://sepwww.stanford.edu/latex2html/cross_ref_motif.gif) . For the events above the salt, the curvatures are not
very obvious, because the velocity model above the salt is relatively simple; however, we can still see that some of the events
are bending at far offsets. For events that are below the salt, the curvatures are more obvious, because with the complex
salt body and limited recording geometry, it is impossible to have the receiver wavefield well sampled.
. For the events above the salt, the curvatures are not
very obvious, because the velocity model above the salt is relatively simple; however, we can still see that some of the events
are bending at far offsets. For events that are below the salt, the curvatures are more obvious, because with the complex
salt body and limited recording geometry, it is impossible to have the receiver wavefield well sampled.
segsalt.off.loc
Figure 8 Migration result for the particular iamge size discribed in the text.
The crosshairs indicate two different surface
locations for output SODCIGs shown in Figure ![[*]](http://sepwww.stanford.edu/latex2html/cross_ref_motif.gif) .
(a) indicates the surface location at (8200,8840);
while (b) indicates the surface location at (8060,8640).
.
(a) indicates the surface location at (8200,8840);
while (b) indicates the surface location at (8060,8640).


 segsalt.off
Figure 9 SODCIGs for two different surface locations shown in
Figure ![[*]](http://sepwww.stanford.edu/latex2html/cross_ref_motif.gif) . The left is the SODCIG extracted at (8200, 8840),
while the right is the SODCIG extracted at (8060, 8640).The vertical axis in both figures is depth,
the inline axis is hx, and the crossline axis is hy.
. The left is the SODCIG extracted at (8200, 8840),
while the right is the SODCIG extracted at (8060, 8640).The vertical axis in both figures is depth,
the inline axis is hx, and the crossline axis is hy.


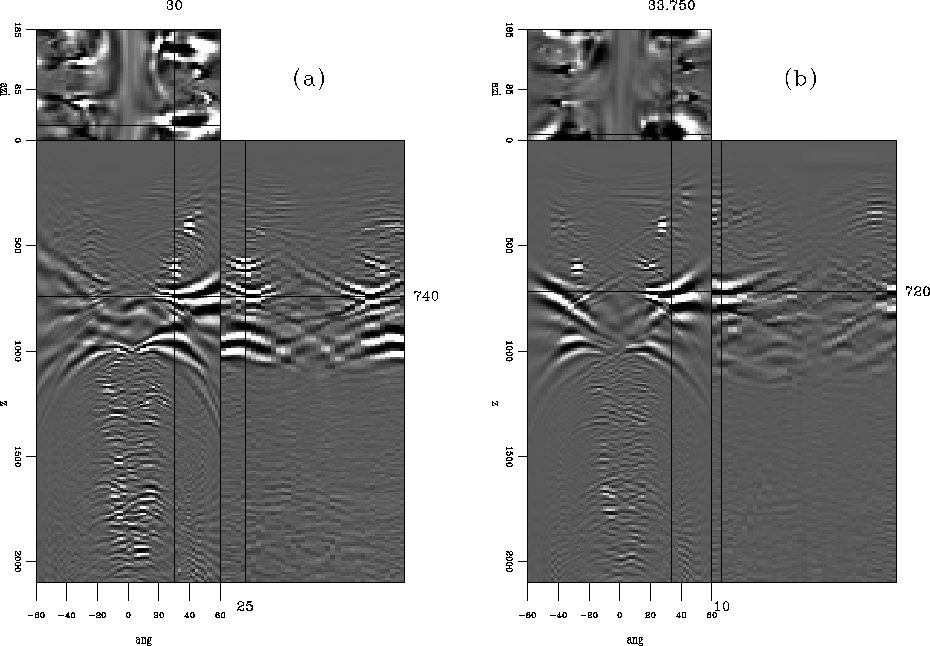
SODCIGs are transformed into 3-D ADCIGs by using equation (3).
The corresponding ADCIGs are shown in
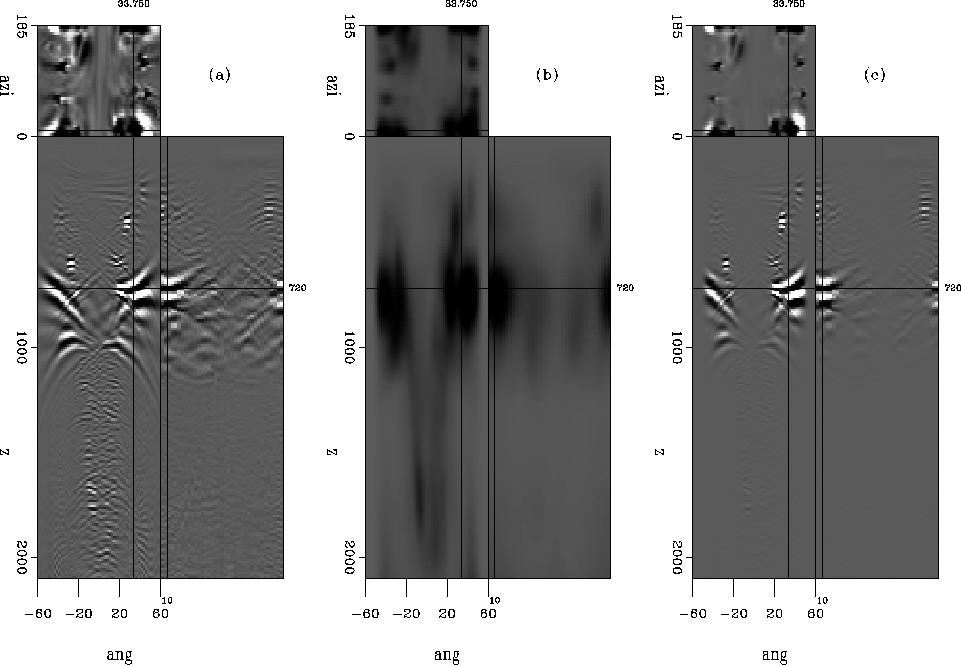
Figure ![[*]](http://sepwww.stanford.edu/latex2html/cross_ref_motif.gif) . The computed azimuth range is from to 180 degrees with a spacing of
5 degrees. Note the blobs in the depth slices in both (a) and (b), which are closely related to
the shot locations.
. The computed azimuth range is from to 180 degrees with a spacing of
5 degrees. Note the blobs in the depth slices in both (a) and (b), which are closely related to
the shot locations.
segsalt.ang
Figure 10 ADCIGs for two different surface locations shown in
Figure ![[*]](http://sepwww.stanford.edu/latex2html/cross_ref_motif.gif) . The left is the ADCIG extracted at (8200, 8840),
while the right is the SODCIG extracted at (8060, 8640). The vertical axis in both figures is depth,
the inline axis is reflection angle, and the crossline axis is reflection azimuth.
. The left is the ADCIG extracted at (8200, 8840),
while the right is the SODCIG extracted at (8060, 8640). The vertical axis in both figures is depth,
the inline axis is reflection angle, and the crossline axis is reflection azimuth.


As demonstrated in the previous section, linear transformation from SODCIGs to ADCIGs is prone to artifacts when the source or
receiver wavefield is poorly sampled (sparsely distributed shot locations or receiver locations). Another possible
reason for artifacts is large velocity contrast in the vicinity of the image point, since the equations for subsurface-offset-to-angle
transformation are valid only in media with locally constant velocity. Artifacts can be easily identified
in ADCIGs for SEG/EAGE salt model as shown in Figure ![[*]](http://sepwww.stanford.edu/latex2html/cross_ref_motif.gif) . We can find smeared energy (tails) in
both near angles and far angles, especially in the top salt and base salt areas, where the velocity contrast is high,
and in the subsalt area, where the wavefields are poorly sampled.
. We can find smeared energy (tails) in
both near angles and far angles, especially in the top salt and base salt areas, where the velocity contrast is high,
and in the subsalt area, where the wavefields are poorly sampled.
To form the final image cube, we have to stack the ADCIGs along both the reflection-angle and reflection-azimuth axes. As the
transformation artifacts are not random, simple stacking without any weighting function might produce images with low
signal-to-noise ratios, making interpretation difficult. The simply stacked image, shown in Figure ![[*]](http://sepwww.stanford.edu/latex2html/cross_ref_motif.gif) (c),
is quite noisy, especially in the subsalt. It is definitely difficult to interpret.
(c),
is quite noisy, especially in the subsalt. It is definitely difficult to interpret.
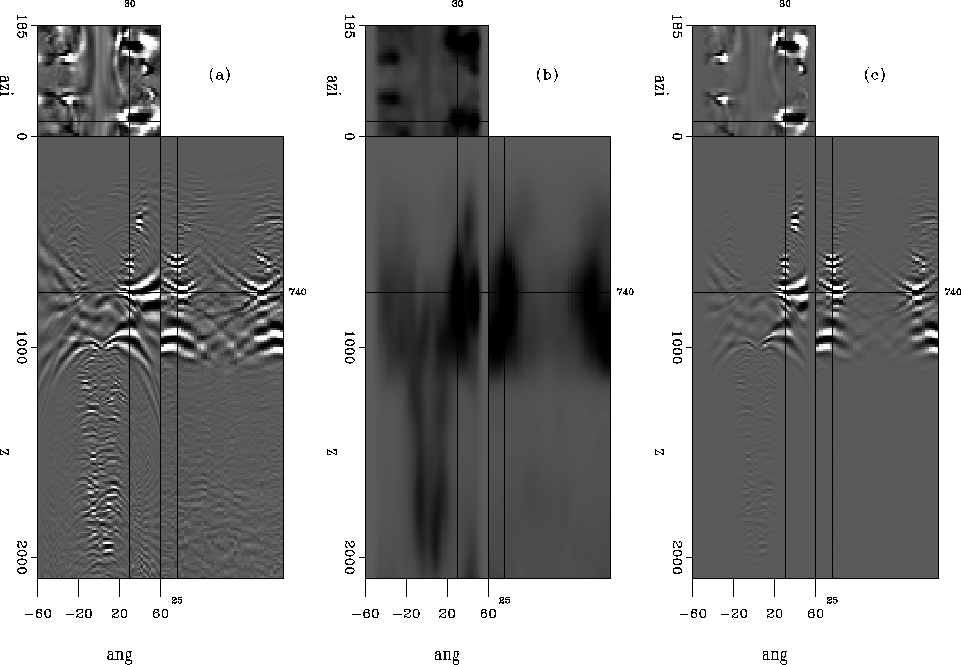
Instead of simply stacking along the angle and azimuth axes, we can apply weighting functions which attenuate
unwanted artifacts to make the stacking process selective. The weighting functions are computed by using
equation (7). Figure ![[*]](http://sepwww.stanford.edu/latex2html/cross_ref_motif.gif) (b) shows the weighting function for the image point at (8200,8840),
while Figure
(b) shows the weighting function for the image point at (8200,8840),
while Figure ![[*]](http://sepwww.stanford.edu/latex2html/cross_ref_motif.gif) shows the weighting function for the image point at (8060,8640). We can see that
horizontally incoherent energy at near and far angles receives low weights,
while horizontally coherent energy, where the actual reflection
is located, receives high weights. Figure
shows the weighting function for the image point at (8060,8640). We can see that
horizontally incoherent energy at near and far angles receives low weights,
while horizontally coherent energy, where the actual reflection
is located, receives high weights. Figure ![[*]](http://sepwww.stanford.edu/latex2html/cross_ref_motif.gif) (c) and Figure
(c) and Figure ![[*]](http://sepwww.stanford.edu/latex2html/cross_ref_motif.gif) (c) show
the filtered results, in which the artifacts are greatly suppressed.
(c) show
the filtered results, in which the artifacts are greatly suppressed.
The weighting functions are computed for every image point and applied to the original ADCIGs, then the filtered ADCIGs are stacked
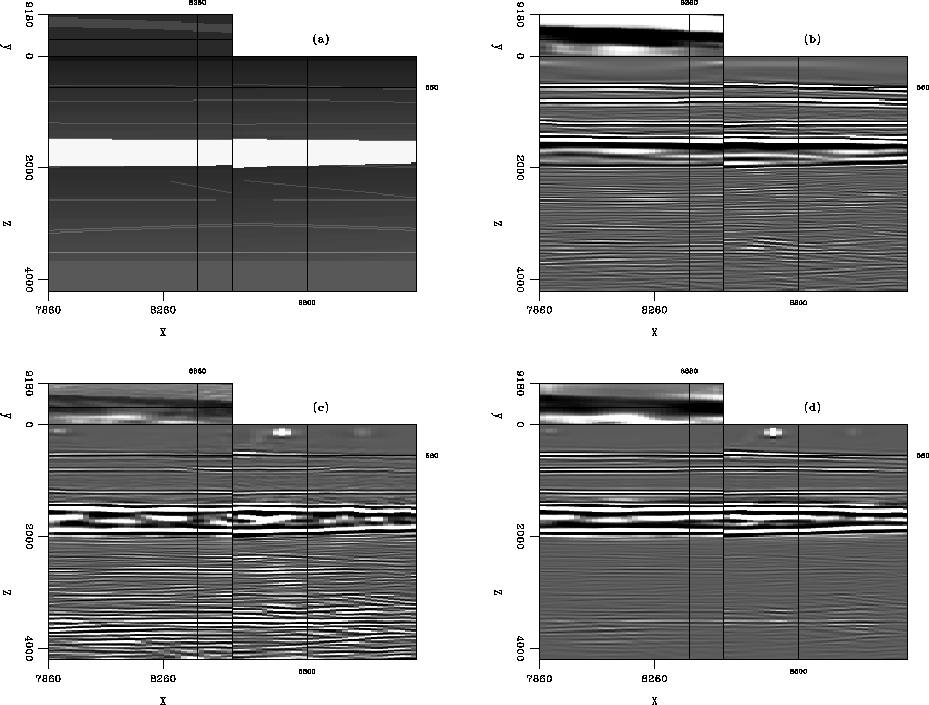
together to form the final image. Figure ![[*]](http://sepwww.stanford.edu/latex2html/cross_ref_motif.gif) (d) shows the result of using this kind of selective stacking.
For comparison, Figure
(d) shows the result of using this kind of selective stacking.
For comparison, Figure ![[*]](http://sepwww.stanford.edu/latex2html/cross_ref_motif.gif) (a) shows the corresponding velocity model, Figure
(a) shows the corresponding velocity model, Figure ![[*]](http://sepwww.stanford.edu/latex2html/cross_ref_motif.gif) (b) shows
the zero-offset image extracted from the SODCIG cube with hx=0 and hy=0, and Figure
(b) shows
the zero-offset image extracted from the SODCIG cube with hx=0 and hy=0, and Figure ![[*]](http://sepwww.stanford.edu/latex2html/cross_ref_motif.gif) (c) shows the image
obtained by simply stacking the ADCIGs without any weighting functions.
It is quite obvious that the image in Figure
(c) shows the image
obtained by simply stacking the ADCIGs without any weighting functions.
It is quite obvious that the image in Figure ![[*]](http://sepwww.stanford.edu/latex2html/cross_ref_motif.gif) (d), obtained by using
selective stacking, has the highest signal-to-noise ratio and it is the cleanest among the three. Also notice the migration artifacts at the bottom of
the image, which can be easily identified in Figures
(d), obtained by using
selective stacking, has the highest signal-to-noise ratio and it is the cleanest among the three. Also notice the migration artifacts at the bottom of
the image, which can be easily identified in Figures ![[*]](http://sepwww.stanford.edu/latex2html/cross_ref_motif.gif) (b) and (c),
but are greatly attenuated in Figure
(b) and (c),
but are greatly attenuated in Figure ![[*]](http://sepwww.stanford.edu/latex2html/cross_ref_motif.gif) (d).
The dipping reflector under the salt on the side panel, which is nearly invisible in Figure
(d).
The dipping reflector under the salt on the side panel, which is nearly invisible in Figure ![[*]](http://sepwww.stanford.edu/latex2html/cross_ref_motif.gif) (b)
and noisy in Figure
(b)
and noisy in Figure ![[*]](http://sepwww.stanford.edu/latex2html/cross_ref_motif.gif) (c), is clearly visible in Figure
(c), is clearly visible in Figure ![[*]](http://sepwww.stanford.edu/latex2html/cross_ref_motif.gif) (d).
(d).
segsalt.ang-2.filt
Figure 11 Filtering result for ADCIG at (8200,8840). Panel (a) shows the original ADCIG,
(b) is the computed weighting function via local smoothing of the envelope function, where
dark color stands for high weight and light color stands for low weight.
Panel (c) is (a) multiplied with (b), i.e. the filtered ADCIG.


 segsalt.ang-3.filt
Figure 12 Filtering result for ADCIG at (8060,8640). Panel (a) shows the original ADCIG,
(b) is the computed weighting function via local smoothing of the envelope function, where
dark color stands for high weight and light color stands for low weight.
Panel (c) is (a) multiplied with (b), i.e. the filtered ADCIG.


 segsalt.stack
Figure 13 Comparison for different results. Panel (a) is the corresponding velocity model;
(b) is the zero-offset image extracted from the SODCIG cube with hx=0 and hy=0;
(c) is the result obtained by simple stacking without any weighting function; and
(d) is the result obtained by selective stacking, with the weighting function computed
by locally smoothing the envelope function of the ADCIGs.


Next: conclusion and discussion
Up: Tang: Imaging in the
Previous: selective stacking based on
Stanford Exploration Project
5/6/2007
![[*]](http://sepwww.stanford.edu/latex2html/cross_ref_motif.gif) , most of the shots are regularly spaced, but
some are not. The receiver geometry is a patching geometry, with minimum offset of
about -2000 meters and maximum offset of about 2000 meters in both the inline and crossline directions.
The plot of azimuth versus absolute offset is shown in Figure
, most of the shots are regularly spaced, but
some are not. The receiver geometry is a patching geometry, with minimum offset of
about -2000 meters and maximum offset of about 2000 meters in both the inline and crossline directions.
The plot of azimuth versus absolute offset is shown in Figure ![[*]](http://sepwww.stanford.edu/latex2html/cross_ref_motif.gif) , which illustrates a fairly wide
coverage of azimuth.
, which illustrates a fairly wide
coverage of azimuth.


