 |
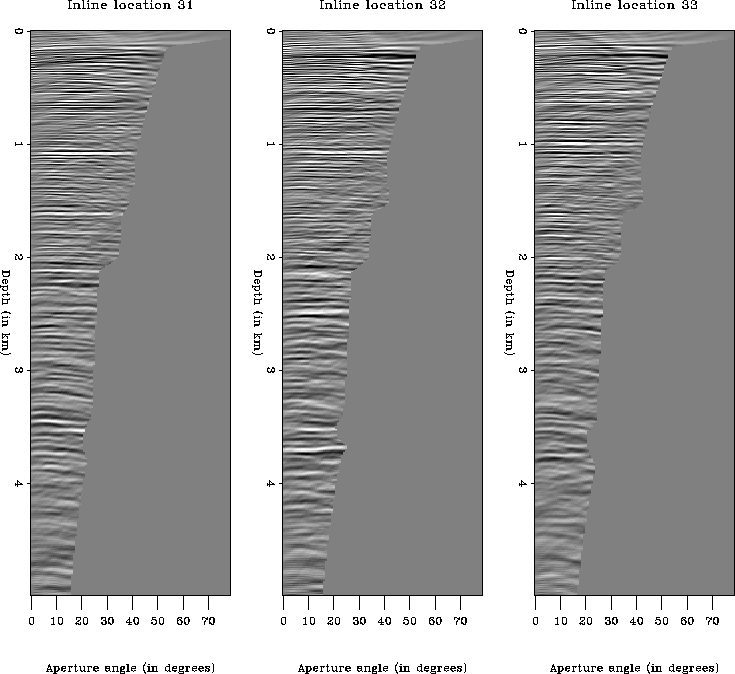
Figure 12 Line 750: ADCIGs at different locations obtained after isotropic migration.
![[*]](http://sepwww.stanford.edu/latex2html/cross_ref_motif.gif) . It can be
observed that up to 2 km depth, reflectors are imaged flat in ADCIGs,
meaning that the migration velocity obtained by CGG is correct and
that no anisotropy in those layers is needed. However, we can observe
that below the Balder horizon (strong reflector at around 1.7 km
depth), the reflectors start curving downward, indicating that the
estimated isotropic migration velocity is larger than the true
migration velocity.
. It can be
observed that up to 2 km depth, reflectors are imaged flat in ADCIGs,
meaning that the migration velocity obtained by CGG is correct and
that no anisotropy in those layers is needed. However, we can observe
that below the Balder horizon (strong reflector at around 1.7 km
depth), the reflectors start curving downward, indicating that the
estimated isotropic migration velocity is larger than the true
migration velocity.
 |
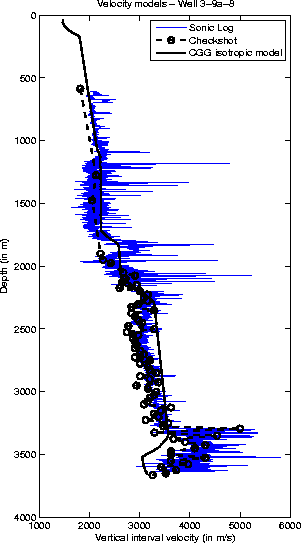
That result is consistent with the sonic velocity recorded
in well 3_9a-8, located at 32.83 km along the CMP axis on line
750. Figure ![[*]](http://sepwww.stanford.edu/latex2html/cross_ref_motif.gif) presents the estimates of the interval
vertical velocity obtained from surface seismic data, measurement of
sonic velocity and checkshot. It illustrates that the vertical velocity
estimated from surface seismic data -- under the assumption of isotropy
-- is accurately estimated down to a depth of around 2 km and is
overestimated deeper between the Balder and BCU horizons.
This overestimation is due to the presence of
anisotropic rocks under the Balder layer. The velocity
measured from surface seismic data (VN) is equal to the vertical
velocity (VV) under the assumption of isotropy and flat
layers. However, in an anisotropic medium, for flat layers and a VTI model,
the expression of the NMO velocity becomes
presents the estimates of the interval
vertical velocity obtained from surface seismic data, measurement of
sonic velocity and checkshot. It illustrates that the vertical velocity
estimated from surface seismic data -- under the assumption of isotropy
-- is accurately estimated down to a depth of around 2 km and is
overestimated deeper between the Balder and BCU horizons.
This overestimation is due to the presence of
anisotropic rocks under the Balder layer. The velocity
measured from surface seismic data (VN) is equal to the vertical
velocity (VV) under the assumption of isotropy and flat
layers. However, in an anisotropic medium, for flat layers and a VTI model,
the expression of the NMO velocity becomes ![]() , where
, where ![]() is the first Thomsen
parameter. Since the velocity measured from seismic data, VN, is
larger than the velocity measured from sonic logs and checkshots, the
anisotropic parameter
is the first Thomsen
parameter. Since the velocity measured from seismic data, VN, is
larger than the velocity measured from sonic logs and checkshots, the
anisotropic parameter ![]() probably can not be considered zero and takes
significantly positive values.
probably can not be considered zero and takes
significantly positive values.
|
Sonic_log
Figure 13 Comparison of the vertical velocities at the location of well 3_9a-8. The different velocities are estimated from seismic surface data (assuming isotropy), measurement of sonic velocity and checkshots. |  |
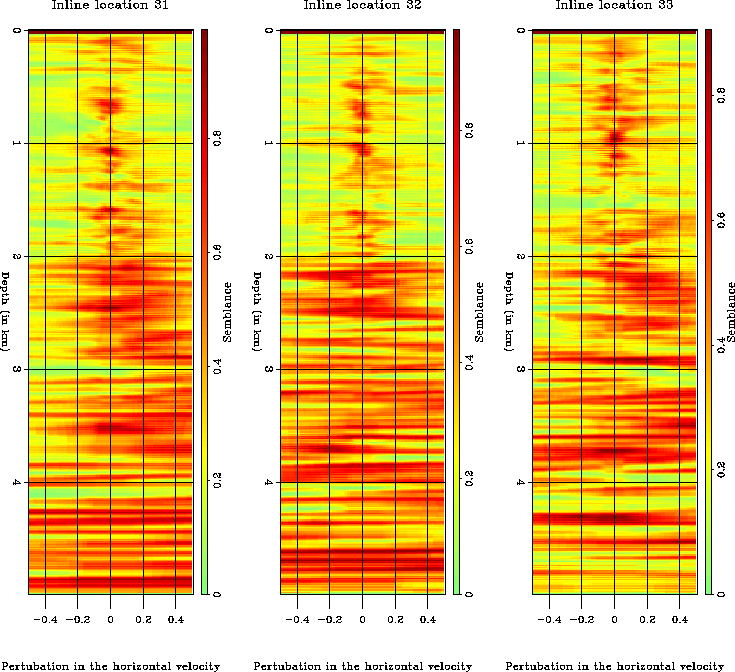
Finally, we computed anisotropic velocity spectra from the three different
ADCIGs illustrated in Figure ![[*]](http://sepwww.stanford.edu/latex2html/cross_ref_motif.gif) . The first series of
velocity spectra are semblance panels of
. The first series of
velocity spectra are semblance panels of ![]() (Figure
(Figure ![[*]](http://sepwww.stanford.edu/latex2html/cross_ref_motif.gif) ). The velocity spectra are computed by
trying to fit the RMO curves in ADCIGs with only
). The velocity spectra are computed by
trying to fit the RMO curves in ADCIGs with only
![]() . Figure
. Figure ![[*]](http://sepwww.stanford.edu/latex2html/cross_ref_motif.gif) illustrates that the VN
was well estimated by CGG since high semblance values are centered
around perturbation values close to zero.
illustrates that the VN
was well estimated by CGG since high semblance values are centered
around perturbation values close to zero.
 |
Semblance panels of ![]() are presented in a second series of
velocity spectra (Figure
are presented in a second series of
velocity spectra (Figure ![[*]](http://sepwww.stanford.edu/latex2html/cross_ref_motif.gif) ). The second series of
velocity spectra is are semblance panels of
). The second series of
velocity spectra is are semblance panels of ![]() . The velocity
spectra are computed by trying to fit the RMO curves in ADCIGs with
only
. The velocity
spectra are computed by trying to fit the RMO curves in ADCIGs with
only ![]() , assuming that VN is
correct. Figure
, assuming that VN is
correct. Figure ![[*]](http://sepwww.stanford.edu/latex2html/cross_ref_motif.gif) illustrates the presence of
anisotropy at a depth greater than 2 km. More specifically, the fact that
the energy is centered at negative values of the
horizontal velocity perturbations indicates that the horizontal
velocity we used for the migration is smaller than the true horizontal
migration velocity. Since our migration was isotropic, we assumed that
VH=VN=VV. As a consequence, we can infer that below 2 km depth, the
anisotropic parameter
illustrates the presence of
anisotropy at a depth greater than 2 km. More specifically, the fact that
the energy is centered at negative values of the
horizontal velocity perturbations indicates that the horizontal
velocity we used for the migration is smaller than the true horizontal
migration velocity. Since our migration was isotropic, we assumed that
VH=VN=VV. As a consequence, we can infer that below 2 km depth, the
anisotropic parameter ![]() probably should not be set to zero
and will take significant positive values
(
probably should not be set to zero
and will take significant positive values
(![]() ).
).
 |