

Next: Conclusion
Up: Application
Previous: Right answer to the
We need a little more "intelligence" in what we ask least squares to do.
In the expression for the sum squared error, the standard approach is to fit a perfectly flat Vphase. Even though I took
some care, as described above, to weight the objective function appropriately over wavenumbers,
and restrict the fit to a range of  ;
I found that trying to fit a "perfect" Vphase leads
to difficulties. Rather than fit a flat Vphase, I fit my "low-order" compact stencil response to the respose of a higher-order method.
In what follows and in practice, I fit to the respose of a much higher-order method with a small time-step size, and Taylor-series derived
spatial difference coefficients.
In addition to fitting a higher-order Taylor response,
I also weight the error at each individual wavenumber by
  , where
  , just to
bias the fit to the low wavenumbers a bit.
Now, I admit this is a somewhat "personal" choice, biased by my desire to preserve tight error bounds on low and mid-range wavenumbers.
I purposefully do not want an equiripple phase velocity respose, because a compact stencil
just has too few degrees of freedom to keep the ripples to
an acceptable level.
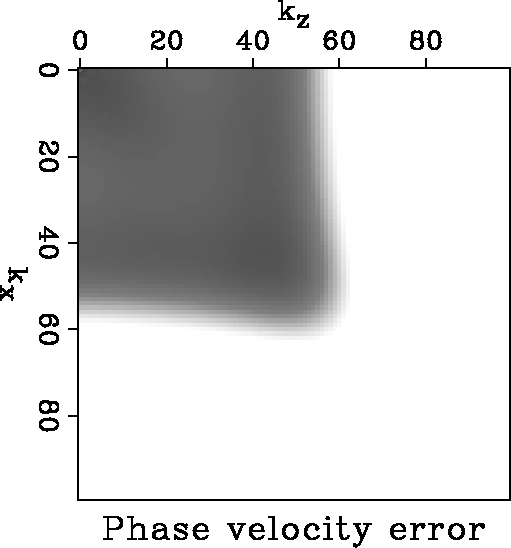
Figure 4 shows a plot of relative phase velocity error for a new set of "optimum" coefficients designed to preserve "good" behavior at low and
moderate wavenumbers
while improving the response at higher wavenumbers compared to Taylor coefficients.
This scheme is very accurate out to 55% of Nyquist, requiring about 3.6 points per shortest wavelength.
This phase velocity spectrum looks reminiscent of the phase velocity spectrum
from a higher-order Taylor method, more of a "pseudo-maxi-flat" response than an "equiripple response", which is exactly what I wanted.
Whether this particular scheme is acceptable or not depends on the amount of oversampling we can tolerate which depends on
the architecture of the computer we plan to use.
The method can design larger
(or down to two degrees of freedom smaller, since this one only has three) stencils,
giving me the ability to adapt to whatever size stencil works best on any particular machine.
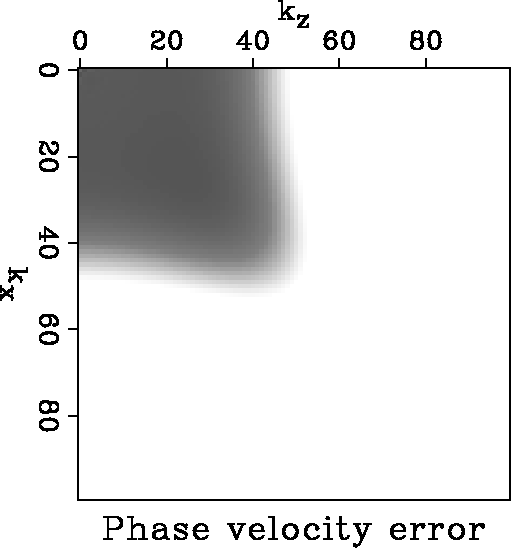
Vphase_taylor6
Figure 1 Relative phase velocity error clipped at 1% for the standard sixth-order in space, second-order in time finite-difference
solution to the 2D acoustic wave equation. Grey areas of the plot have phase velocity close to the desired phase velocity. White areas have relative phase velocity error > 1% slow.


 Vphase_opt_7pt_naive
Figure 2 Relative phase velocity error clipped at 1% for an
optimized finite-difference stencil with seven points on each spatial axis. Grey areas of the plot have nearly correct phase velocity.
White areas of the plot have phase velocity too slow by >1%; Black areas of the plot
have phase velocity >1% too fast. The optimization criterion was "too aggressive", resulting in an unacceptable fit .


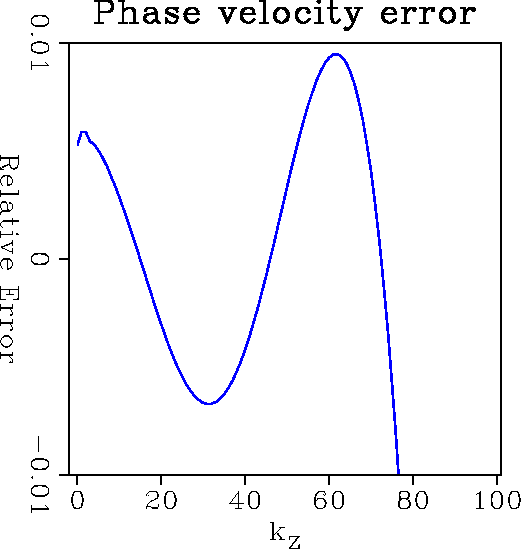
 Vphase_opt_7pt_naive_graph
Figure 3 Graph of relative phase velocity error along the kz axis showing approximate equiripple error. This amount of error is probably too large, although the fitting range is quite high, out to almost 80% of Nyquist.


 Vphase_opt_7pt_improved
Figure 4 Relative phase velocity error
clipped at 1% for an optimized finite-difference stencil with seven points on each spatial axis.
Although the range of wavenumbers fit is smaller than in Figure 2, this set of difference coefficients can propagate accurately waves that are sampled at about 3.6 points per wavelength.


Next: Conclusion
Up: Application
Previous: Right answer to the
Stanford Exploration Project
5/6/2007


