


Next: RESULTS
Up: Berryman and Grechka: Random
Previous: MODELING APPROACH
Grechka and Kachanov (2006a,b) have generated two distinct numerical data sets
for crack densities  , 0.10, 0.15, and 0.20. (Crack
density is defined as
, 0.10, 0.15, and 0.20. (Crack
density is defined as  , where n is the number density
per unit volume. Radius of a typical crack is a.
If there is a distribution of crack sizes, then na3 is replaced by
an appropriate average value.) Cracks are all penny-shaped, but not necessarily flat. We assume that the
aspect ratio is small (but finite, i.e., nonzero) and,
therefore, we can ignore it here.
, where n is the number density
per unit volume. Radius of a typical crack is a.
If there is a distribution of crack sizes, then na3 is replaced by
an appropriate average value.) Cracks are all penny-shaped, but not necessarily flat. We assume that the
aspect ratio is small (but finite, i.e., nonzero) and,
therefore, we can ignore it here.
The two models considered have very different Poisson's ratios for the
isotropic background media: (1)  and
(2)
and
(2)  . We will call these two models,
respectively, the first model and the second model.
The first model corresponds to a rigid medium very stiff under shear,
while the second model corresponds to a medium much more compliant
in shear.
The two models approximately bracket the expected range of
behavior in earth systems, for which a typical value might be
. We will call these two models,
respectively, the first model and the second model.
The first model corresponds to a rigid medium very stiff under shear,
while the second model corresponds to a medium much more compliant
in shear.
The two models approximately bracket the expected range of
behavior in earth systems, for which a typical value might be
 in reservoir rocks.
The first model has background stiffness matrix values
C11 = C22 = C33 = 13.75 GPa,
C12 = C13 = C23 = 0.00 GPa, and
C44 = C55 = C66 = 6.875 GPa. Bulk modulus for this model
is therefore K0 = 4.583 GPa and shear modulus is G0 = 6.875 GPa.
The second model has stiffness matrix values
C11 = C22 = C33 = 19.80 GPa,
C12 = C13 = C23 = 15.40 GPa, and
C44 = C55 = C66 = 2.20 GPa. Bulk modulus for this model
is therefore K0 = 16.86 GPa and shear modulus is G0 = 2.20 GPa.
The second model also corresponds to a background material having
compressional wave speed Vp = 3 km/s, shear wave speed Vs = 1 km/s,
and mass density
in reservoir rocks.
The first model has background stiffness matrix values
C11 = C22 = C33 = 13.75 GPa,
C12 = C13 = C23 = 0.00 GPa, and
C44 = C55 = C66 = 6.875 GPa. Bulk modulus for this model
is therefore K0 = 4.583 GPa and shear modulus is G0 = 6.875 GPa.
The second model has stiffness matrix values
C11 = C22 = C33 = 19.80 GPa,
C12 = C13 = C23 = 15.40 GPa, and
C44 = C55 = C66 = 2.20 GPa. Bulk modulus for this model
is therefore K0 = 16.86 GPa and shear modulus is G0 = 2.20 GPa.
The second model also corresponds to a background material having
compressional wave speed Vp = 3 km/s, shear wave speed Vs = 1 km/s,
and mass density  kg/m3.
The numerical modeling of Grechka and Kachanov (2006a,b)
for the first model
resulted in 110 examples: 23 for , 21 for  ,35 for
  , and 31 for
  . Of these 110 cases,
we used 79 (selected randomly for the three smaller crack densities):
8 for , 16 for , 24 for ,
and all 31 for .
. Of these 110 cases,
we used 79 (selected randomly for the three smaller crack densities):
8 for , 16 for , 24 for ,
and all 31 for .
The numerical modeling of Grechka and Kachanov (2005,2006a,b)
for the second model
resulted in 100 examples: 25 each for all four cases  . Of these 100 cases, we used 73 (selected
randomly for the three smaller crack densities): 8 for ,
16 for , 24 for , and all 25 for .
. Of these 100 cases, we used 73 (selected
randomly for the three smaller crack densities): 8 for ,
16 for , 24 for , and all 25 for .
For both numerical data sets, the output of the modeling for each
example was a stiffness matrix. All these matrices were observed to
be essentially orthotropic in character (i.e., depending
significantly only on the nine stiffness constants
C11, C22, C33, C12 = C21, C13 = C31,
C23 = C32, C44, C55, C66 -- meaning that the remaining
off-diagonal coefficients are negligible). In order to produce
results useful for graphical comparisons, these orthotropic matrices
were used to compute the Voigt-Reuss-Hill averages of bulk and shear
moduli. So the Voigt and Reuss averages KV and KR were
computed for each matrix, and arithmetic average
KVRH = (KR + KV)/2 was obtained as a measure of the bulk
modulus for the stiffness matrix. Then, a similar calculation was done for the
shear modulus GVRH. Formulas for all these averages are given for
orthotropic
elastic stiffness matrices by Watt (1979). The results (VRH) are plotted as
red  's in Figures 2-9, where the numerical results are also
compared to results from the differential scheme (DS), the non-interacting
approximation (NI), and various bounds and estimates based on random
polycrystals of cracked grains (R,HS-,SC,HS+,V).
's in Figures 2-9, where the numerical results are also
compared to results from the differential scheme (DS), the non-interacting
approximation (NI), and various bounds and estimates based on random
polycrystals of cracked grains (R,HS-,SC,HS+,V).
We also show two other estimates: SMP for ``sample,'' and GR for ``grain.''
Since these computations were all done using displacement boundary
conditions, we have made use of results from Huet (1990) on sampling -- the pertinent result being that effective overall stiffness
Cij* of a random medium (one having a well-defined statistical ensemble
associated with it) satisfies
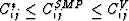 , where
|  |
(1) |
and where the Cijn are subsamples of the collection of
local stiffnesses in the ensemble.
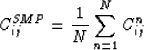
For present purposes, we can choose to think of the individual
stiffness matrices found in the numerical experiments as being
just such representatives selected randomly from the overall ensemble.
Then, the SMP value we use is the one based on the values
N = 8, 16, 24, etc., for the cases considered in the numerical experiments.
Clearly, the value we obtain this way for CijSMP is merely an
estimate of the true average value, based on our rather limited
statistics. But we find that the fluctuations in these averages are
quite small already with the stated sample numbers used here, and so
we conclude that the approach is in fact useful even for such
apparently small sample statistics. Furthermore, the plotted values
KSMP and GSMP are the Voigt averages for bulk and
shear modulus obtained from the stiffness average CijSMP.
For comparison purposes, we also provide the values KGR and
GGR, which are the Reuss averages associated again with
stiffness average CijSMP. These values have
no special theoretical significance
in terms of the analysis of Huet (1990), as the more appropriate bounding values from below should be
obtained -- not from the stiffness obtained for
displacement boundary conditions but -- instead for the compliance
determined in a numerical experiment applying traction boundary conditions.
But for the available data sets, we did not have this additional
information. One further motivation, however, for presenting these
values KGR and GGR is that the stiffness CijSMP is
in some fairly precise sense the stiffness of an ``average'' cracked
grain in the overall polycrystal model.
The bulk modulus of this ``average'' cracked grain is given precisely
by the value KGR, but there is no corresponding statement that
can be made about the shear modulus of this same average grain. So GGR
is just a special estimate, or heuristic value, that can be easily computed;
and its significance should therefore not be overinterpreted.
One class of approximations that has been found very useful for
analysis of these cracked systems by Grechka and Kachanov (2006a,b)
is the non-interaction approximation (NIA).
Since our results will be presented in the form of plots of
effective bulk and shear moduli, it is useful to consider the
corresponding NIA formulas for bulk and shear moduli. Zimmerman (1991)
gives such formulas, and in our present notation
these formulas are:
|  |
(2) |
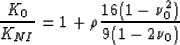
for effective bulk modulus KNI, and
| 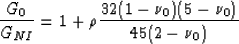 |
(3) |
for effective shear modulus GNI. The host medium has
bulk modulus K0, shear modulus G0, and Poisson's ratio
 . Again, the crack density ,where n is the number of cracks per unity volume, and
a is the radius of the (assumed) penny-shaped cracks.
In particular, we note that in a plot of inverse bulk modulus and/or
inverse shear modulus versus crack density
. Again, the crack density ,where n is the number of cracks per unity volume, and
a is the radius of the (assumed) penny-shaped cracks.
In particular, we note that in a plot of inverse bulk modulus and/or
inverse shear modulus versus crack density  , the NIA results are just
straight lines. This general feature of NIA suggests that it is most
fruitful to construct our plots in this way in order to
distinguish easily whether the results are behaving according to NIA
predictions -- or not. In fact, we find that, although the NIA gives
good agreement for some of the numerical results, in general there
are deviations from NIA, and that the polycrystal of cracked grains
model gives a better representation of the numerical results.
, the NIA results are just
straight lines. This general feature of NIA suggests that it is most
fruitful to construct our plots in this way in order to
distinguish easily whether the results are behaving according to NIA
predictions -- or not. In fact, we find that, although the NIA gives
good agreement for some of the numerical results, in general there
are deviations from NIA, and that the polycrystal of cracked grains
model gives a better representation of the numerical results.
Another method that we use here involves a crack-influence
decomposition method of Sayers and Kachanov (1991); see Appendix B for details.
When all cracks in the system have the same vertical (z-)axis
of symmetry, then the cracked/fractured system is not isotropic,
and we have the compliance correction matrix
| 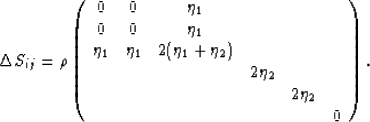 |
(4) |
(In fact, we will show later that  corrections in
(4) are usually negligible compared to the
corrections in
(4) are usually negligible compared to the
 corrections. This also holds true in other formulas
for compliance corrections, but we nevertheless carry along in the formulas for completeness [see (15)].)
Now it is also not difficult to see that, if the cracks were oriented
instead so that all their normals were pointed horizontally along the
x-axis, then we would have one permutation of this matrix and, if
instead they were all pointed horizontally along the y-axis, then
we would have a third permutation of the matrix. Averaging
these three permutations by adding the three
corrections. This also holds true in other formulas
for compliance corrections, but we nevertheless carry along in the formulas for completeness [see (15)].)
Now it is also not difficult to see that, if the cracks were oriented
instead so that all their normals were pointed horizontally along the
x-axis, then we would have one permutation of this matrix and, if
instead they were all pointed horizontally along the y-axis, then
we would have a third permutation of the matrix. Averaging
these three permutations by adding the three  's together
and then dividing by three, we obtain the isotropic compliance
corrections matrix
's together
and then dividing by three, we obtain the isotropic compliance
corrections matrix
| 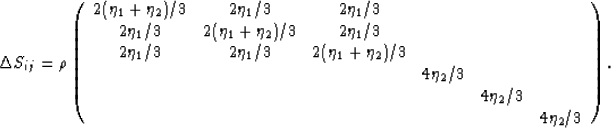 |
(5) |
Then, since the unperturbed compliance matrix is related to
Young's modulus E0, Poisson's ratio  , and shear modulus G0 by
| 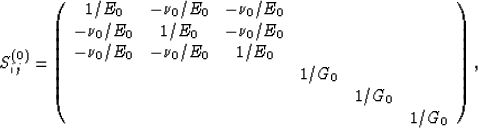 |
(6) |
we find easily that
|  |
(7) |
and
|  |
(8) |
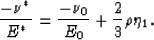
Solving these equations for the  's, we have
| 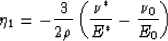 |
(9) |
and
| 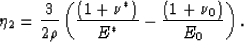 |
(10) |
Since 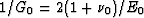 for an isotropic system, we also have the
consistency check that
for an isotropic system, we also have the
consistency check that
|  |
(11) |
Similarly, since 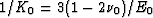 , we also have
| 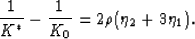 |
(12) |
This construction shows in part both the power and the simplicity of
the Sayers and Kachanov (1991) approach, also used by
Bazant and Planas (1998).
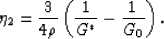
The crack influence decomposition parameters and can be
evaluated using the formulas presented for any convenient value of the crack
density . But this procedure is seen to be most useful if we evaluate
the parameters at small , since in that limit all the standard methods
should give essentially the same results. This approach has been tested
and found to be correct.
Once it is known that it makes little difference at low crack
densities which theoretical methods we use to estimate the
crack-influence parameters, we might as well consider the simplest
one, which is surely the non-interaction approximation.
Combining (2) and (3) with
(11) and (12), we find easily that,
within the NIA,
|  |
(13) |
and
|  |
(14) |
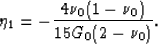
The ratio of these expressions is
| 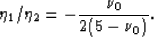 |
(15) |
This shows that, when  ,
,
| 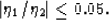 |
(16) |
So,  is never larger than about
  of ,and, for small values of , the ratio is substantially smaller.
A typical value for tight sandstones is
of ,and, for small values of , the ratio is substantially smaller.
A typical value for tight sandstones is  .This corresponds to a wave speed ratio
![$V_s/V_p = \left[\frac{2(1-\nu)}{(1-2\nu)}\right]^{1/2} \simeq 0.4$](img42.gif) ,which is typical of both shales and sandstones. It follows that
the value of is
about 4% of that for in many important geophysical applications.
Thus, its value is suffficiently small so that we are often justified
in neglecting in data analysis problems for real earth systems
and rocks.
,which is typical of both shales and sandstones. It follows that
the value of is
about 4% of that for in many important geophysical applications.
Thus, its value is suffficiently small so that we are often justified
in neglecting in data analysis problems for real earth systems
and rocks.
Once values of  and
and  are known in this
way (using NIA as shown or some other method), we can use the Sayers and
Kachanov (1991) method as one convenient way to study and
evaluate anisotropic behavior in cracked systems --
thus, providing a simple method of extending the non-interaction
approximation results, as quoted by Zimmerman (1991),
to nonisotropic systems. We then introduce some crack-crack interactions
here in a novel way by making use of the polycrystal of cracked-grains model.
are known in this
way (using NIA as shown or some other method), we can use the Sayers and
Kachanov (1991) method as one convenient way to study and
evaluate anisotropic behavior in cracked systems --
thus, providing a simple method of extending the non-interaction
approximation results, as quoted by Zimmerman (1991),
to nonisotropic systems. We then introduce some crack-crack interactions
here in a novel way by making use of the polycrystal of cracked-grains model.
Appendix B summarizes the main analysis using the crack-influence
parameter approach of the Sayers and Kachanov (1991) method.
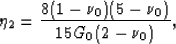
We find that, in addition to the two parameters
and that are easily found using effective medium
theories such as NIA or DS (differential scheme), there are three more
parameters that are expected to play a role in our results at higher
crack densities:  ,
,  , and
, and  . These are the only
significant quadratic corrections to (4). The analysis shows
[see, for example, Eq. (40)] that to second
order in the crack
density , we need to replace by
. These are the only
significant quadratic corrections to (4). The analysis shows
[see, for example, Eq. (40)] that to second
order in the crack
density , we need to replace by  and by
  . In addition, the parameter
comes into play, but perturbs only the S33 component of
the compliance. The Reuss averages of shear modulus and bulk modulus
are now given by
. In addition, the parameter
comes into play, but perturbs only the S33 component of
the compliance. The Reuss averages of shear modulus and bulk modulus
are now given by
| ![\begin{displaymath}
\frac{1}{G_R} - \frac{1}{G_0} = \frac{4\rho}{3}\left[\eta_2
+ (\eta_5 + 2\eta_3/5)\rho\right]
\end{displaymath}](img50.gif) |
(17) |
and
| ![\begin{displaymath}
\frac{1}{K_R} - \frac{1}{K_0} = 2\rho\left[\eta_2 + (\eta_3 + \eta_5)\rho +
3(\eta_1 + \eta_4\rho)\right],
\end{displaymath}](img51.gif) |
(18) |
respectively, instead of (11) and (12).
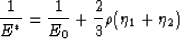
Furthermore, since it has been found empirically that the shear modulus
estimates given by the NIA are quite accurate for the polycrystals of
cracked-grains model, we conclude that it is generally true that
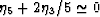 , which approximately eliminates one
degree of freedom in our three parameter (, ,) fitting method.
, which approximately eliminates one
degree of freedom in our three parameter (, ,) fitting method.
Also, recall that we are focusing here on penny-shaped (and therefore
ellipsoidal) cracks. Phenomenology for other crack shapes may differ
somewhat from the discussion presented here (Mavko and Nur, 1978).
However, other shapes are beyond our present scope and so will
necessarily be treated elsewhere. The numerical experiments considered
here all used ellipsoidal cracks.
Next: RESULTS
Up: Berryman and Grechka: Random
Previous: MODELING APPROACH
Stanford Exploration Project
1/16/2007