

Next: Conclusion
Up: GAUSSPYR: Sen
Previous: Gaussian Pyramid Interpolation
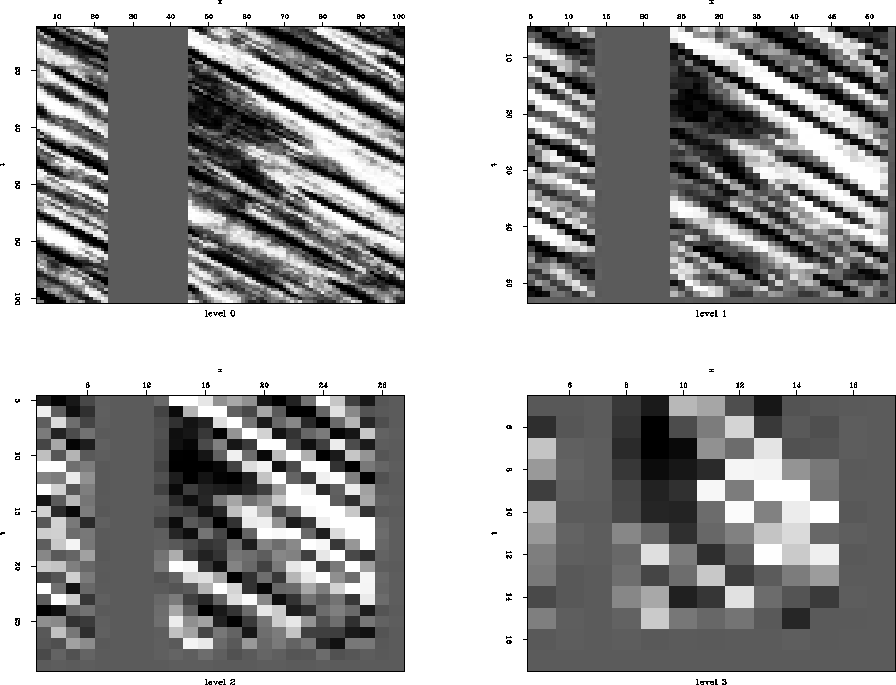
In this section I demonstrate some of the results of applying the Gaussian interpolation scheme to different datsets. In each of the examples a rectangular hole is punched in dataset which is then filled up using Gaussian pyramid interpolation.I compare the results obtained using the Gaussian pyramid scheme with those obtained from filling the hole using a regular prediction filter approach. The first example is the "Wood" example from Jon Claerbot's book Claerbout (2005). Figure ![[*]](http://sepwww.stanford.edu/latex2html/cross_ref_motif.gif) shows four levels of the pyramid structure. At the fourth level the hole is only 2 point long. We use linear prediction to fill in this hole. This filled level is then expanded to the next lower level which has a missing region. This missing region is filled up using the information available from the expanded filled level and this process is repeated till we reach the base of the pyramid. The results of filling up the hole by this method is shown in Figure
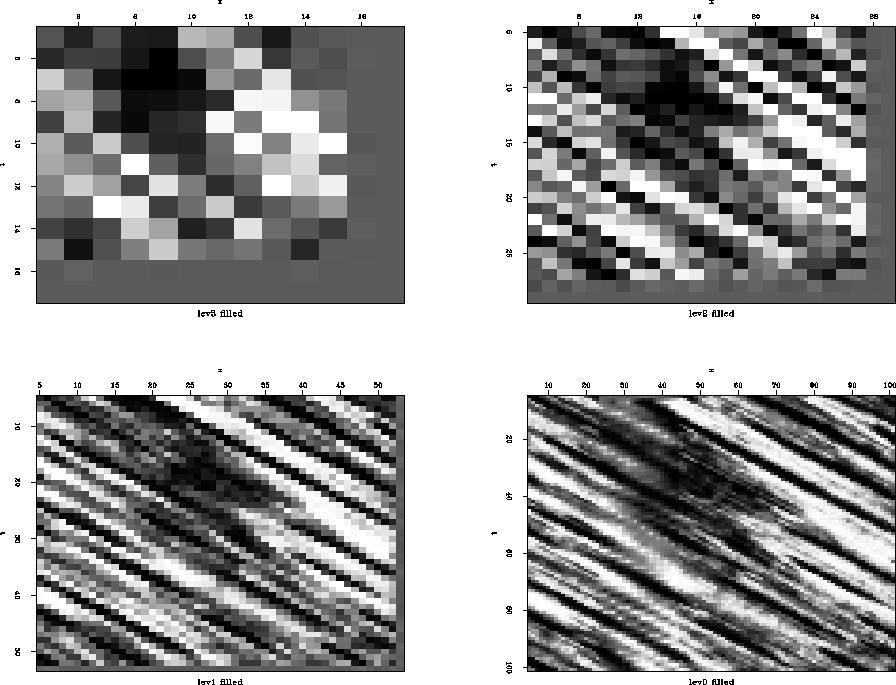
shows four levels of the pyramid structure. At the fourth level the hole is only 2 point long. We use linear prediction to fill in this hole. This filled level is then expanded to the next lower level which has a missing region. This missing region is filled up using the information available from the expanded filled level and this process is repeated till we reach the base of the pyramid. The results of filling up the hole by this method is shown in Figure ![[*]](http://sepwww.stanford.edu/latex2html/cross_ref_motif.gif) . The top most panel on the left is the upper most level of the pyramid which is first filled up using linear prediction. The lower right panel is the original image that has been filled up. For this example 2 iterations of the pyramid formation and expansion process is done. The reason for this is to improve the pixel quality in and around the hole during the expansion process.Figure
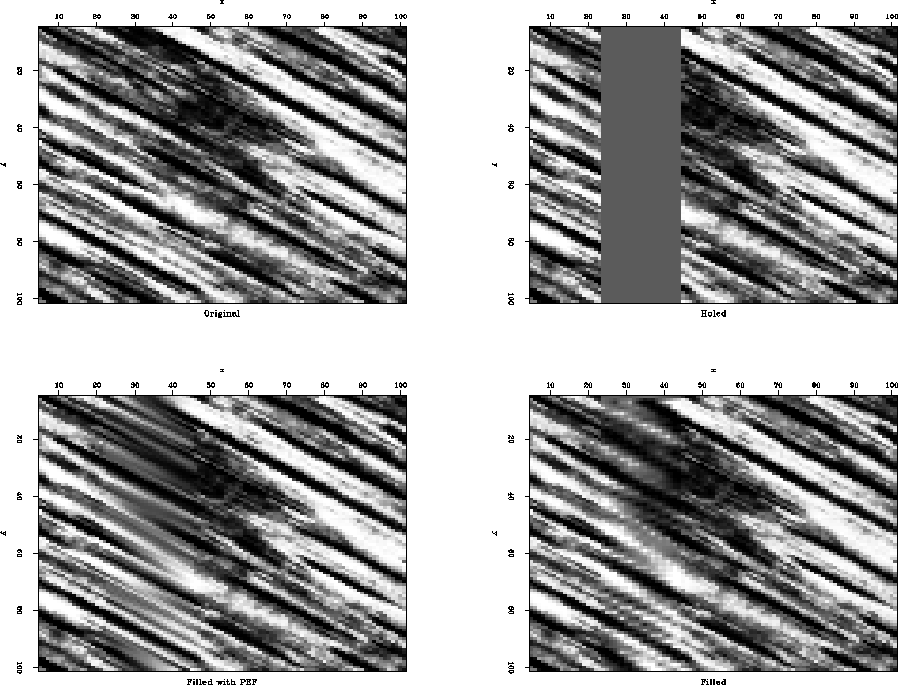
. The top most panel on the left is the upper most level of the pyramid which is first filled up using linear prediction. The lower right panel is the original image that has been filled up. For this example 2 iterations of the pyramid formation and expansion process is done. The reason for this is to improve the pixel quality in and around the hole during the expansion process.Figure ![[*]](http://sepwww.stanford.edu/latex2html/cross_ref_motif.gif) compares the result of the interpolation process using the pyramid scheme with that obtained using a prediction error filter (PEF) approach. The top two panels show the original data (right) and the data with holes punched into it (top left). The lower two panels show the results using a PEF (lower left) and the pyramid scheme (lower right). The results are of comparable quality, except at the top and lower boundaries where the pyramid scheme has troubles due to edge effects during the expansion and reduction process.
compares the result of the interpolation process using the pyramid scheme with that obtained using a prediction error filter (PEF) approach. The top two panels show the original data (right) and the data with holes punched into it (top left). The lower two panels show the results using a PEF (lower left) and the pyramid scheme (lower right). The results are of comparable quality, except at the top and lower boundaries where the pyramid scheme has troubles due to edge effects during the expansion and reduction process.
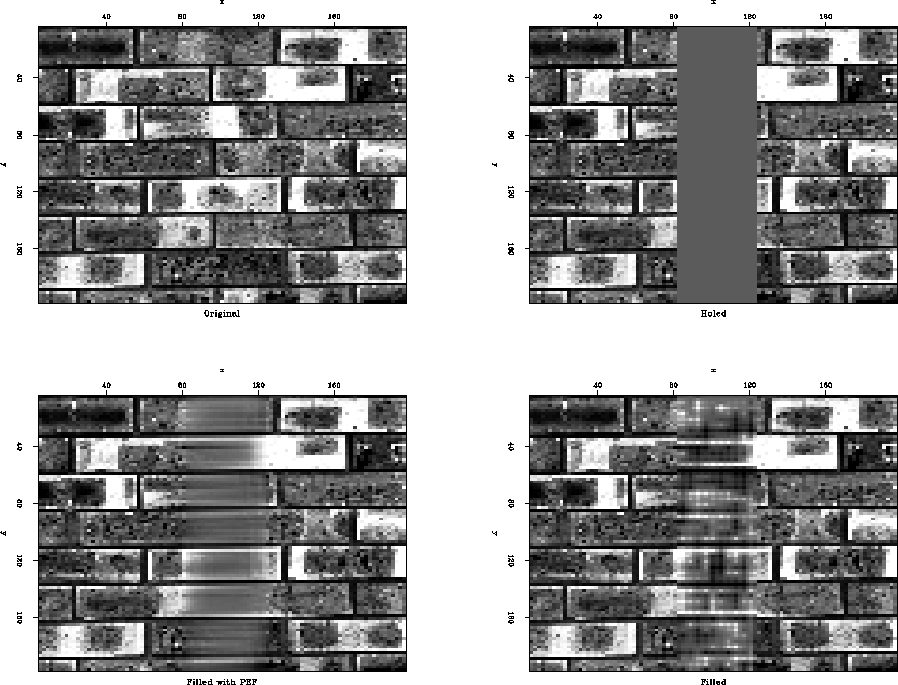
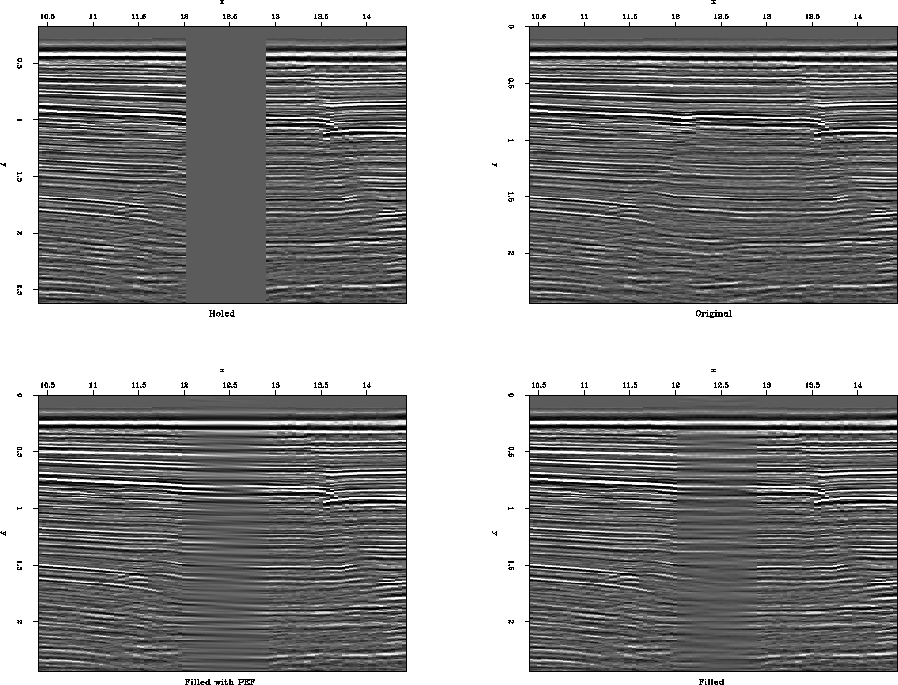
The second example consists of the "Brick" dataset again from Jon Claerbot's book Claerbout (2005). Here three levels of the Gaussian pyramid are constructed and 2 iterations are done for the pyramid formation and expansion process. Figure ![[*]](http://sepwww.stanford.edu/latex2html/cross_ref_motif.gif) compares the interpolation result oultined here with the PEF based approach (lower two panels of figure
compares the interpolation result oultined here with the PEF based approach (lower two panels of figure ![[*]](http://sepwww.stanford.edu/latex2html/cross_ref_motif.gif) ). The interpolation result is pretty satisfactory, except for the blurring effect in the missing region. The third example consists of the "Herring bone" dataset. Figure
). The interpolation result is pretty satisfactory, except for the blurring effect in the missing region. The third example consists of the "Herring bone" dataset. Figure ![[*]](http://sepwww.stanford.edu/latex2html/cross_ref_motif.gif) compares the interpolation result with that of the original dataset. The hole is again being filled relatively well.
compares the interpolation result with that of the original dataset. The hole is again being filled relatively well.
woodhole
Figure 5 Four levels of the Gaussian pyramid.


 woodfill
Figure 6 Filled levels of the Gaussian pyramid starting from the uppermost level (top left) to the lowermost level (bottom right).


 woodcomp
Figure 7 Data with holes (top left), original data (top right), filled using PEF (bottom left) and filled using the pyramid scheme (bottom right).


 brickcomp
Figure 8 Data with holes (top left), original data (top right), filled using PEF (bottom left) and filled using the pyramid scheme (bottom right).


 herrcomp
Figure 9 Data with holes (left), original data (middle) and filled data (right).


 WGstackpyr
Figure 10 Three levels of the pyramid for the stacked seismic section.


 WGstackcomp
Figure 11 Data with holes (left), original data (middle) and filled data (right).


The fourth example consists of a stacked seismic section. Again a hole is punched in the middle (left panel of Figure ![[*]](http://sepwww.stanford.edu/latex2html/cross_ref_motif.gif) ) which we try and restore. Three levels of the pyramid structure for this example is shown in Figure
) which we try and restore. Three levels of the pyramid structure for this example is shown in Figure ![[*]](http://sepwww.stanford.edu/latex2html/cross_ref_motif.gif) . After the third level the hole is four points long, which is filled up using normalized linear prediction. The expansion and filling up, starting from the third level of the pyramid is started, and the results of interpolation are shown in Figure
. After the third level the hole is four points long, which is filled up using normalized linear prediction. The expansion and filling up, starting from the third level of the pyramid is started, and the results of interpolation are shown in Figure ![[*]](http://sepwww.stanford.edu/latex2html/cross_ref_motif.gif) . The method has trouble trying to interpolate the uncollapsed diffraction hyperbolas and other artifacts present in the stacked section.
. The method has trouble trying to interpolate the uncollapsed diffraction hyperbolas and other artifacts present in the stacked section.


Next: Conclusion
Up: GAUSSPYR: Sen
Previous: Gaussian Pyramid Interpolation
Stanford Exploration Project
4/5/2006
![[*]](http://sepwww.stanford.edu/latex2html/cross_ref_motif.gif) compares the interpolation result oultined here with the PEF based approach (lower two panels of figure
compares the interpolation result oultined here with the PEF based approach (lower two panels of figure ![[*]](http://sepwww.stanford.edu/latex2html/cross_ref_motif.gif) ). The interpolation result is pretty satisfactory, except for the blurring effect in the missing region. The third example consists of the "Herring bone" dataset. Figure
). The interpolation result is pretty satisfactory, except for the blurring effect in the missing region. The third example consists of the "Herring bone" dataset. Figure ![[*]](http://sepwww.stanford.edu/latex2html/cross_ref_motif.gif) compares the interpolation result with that of the original dataset. The hole is again being filled relatively well.
compares the interpolation result with that of the original dataset. The hole is again being filled relatively well.
