


Figure ![[*]](http://sepwww.stanford.edu/latex2html/cross_ref_motif.gif) shows graphically how the data input into LA is
selected from a sampled 1D function. The continuous signal is assumed
to be sampled only at the tick marks on the axis and therefore has 14
amplitude values. The heavy dark line above the axis represents a
threshold of approximately 25% of the maximum amplitude, shown by the
uppermost dashed line. The data values have been quantized into three
levels above the threshold. The dots show how many times each
coordinate is selected for input into LA. The coordinate set formed from
the signal is therefore
shows graphically how the data input into LA is
selected from a sampled 1D function. The continuous signal is assumed
to be sampled only at the tick marks on the axis and therefore has 14
amplitude values. The heavy dark line above the axis represents a
threshold of approximately 25% of the maximum amplitude, shown by the
uppermost dashed line. The data values have been quantized into three
levels above the threshold. The dots show how many times each
coordinate is selected for input into LA. The coordinate set formed from
the signal is therefore ![]() .
.
|
data
Figure 1 Dots represent coordinate selection as a function of squared signal amplitude for input into Lloyd's Algorithm. | 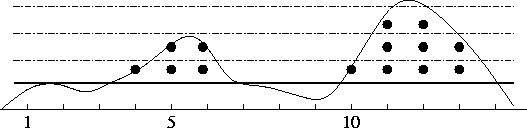 |

Assuming that the linear operator chosen for the transform is appropriate, the model space should be mostly low amplitude or zero. Therefore, the pre-selection of coordinates for LA reduces the model space by several orders of magnitude. The selected model-space coordinates are input into LA whose output is a list of optimal locations that represent the energy in the model space of the transform. These are written out to a SEP77 file and a ASCII file formatted for input into Ricksep as a picks file.