

Next: Applications
Up: Witten: Quaternion-based Signal Processing
Previous: Quaternionic Disparity Estimation
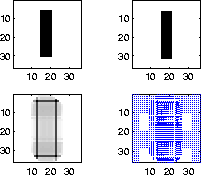
Figure ![[*]](http://sepwww.stanford.edu/latex2html/cross_ref_motif.gif) shows an instructive example with a shifted rectangular block.
The upper left panel is the original block position while the upper right panel
shows the same block shifted down and to the right by one point. On the bottom, the disparity is shown as both a
magnitude and
vector plot of the shift.
block1
shows an instructive example with a shifted rectangular block.
The upper left panel is the original block position while the upper right panel
shows the same block shifted down and to the right by one point. On the bottom, the disparity is shown as both a
magnitude and
vector plot of the shift.
block1
Figure 2 Top row: the input images.
Bottom row: The disparity as a magnitude and a vector representation of disparity


 block2
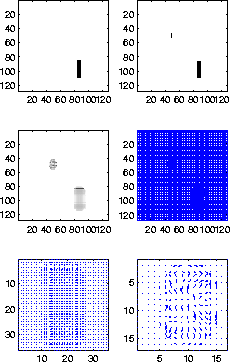
Figure 3 Top row: Images to be compared.
Notice the appearance of the small block. Middle row: The magnitude
and vector representations of the disparity using the
pseudo-average. Bottom row: Zoomed image of the large block's and
small block's, respectively, disparity in vector representation.


Figure ![[*]](http://sepwww.stanford.edu/latex2html/cross_ref_motif.gif) is similar to
figure
is similar to
figure ![[*]](http://sepwww.stanford.edu/latex2html/cross_ref_motif.gif) except that, in addition to the larger
rectangle, a smaller rectangle has appeared. If the disparity
estimate were to run in the ``forward'' direction, then this block
would be invisible. This is because it is based upon the
derivative of the local phase of the left panel where the small block does
not appear. In the ``reverse'' direction, however, the small block shows up. To remedy this, a pseudo-average is taken,
except that, in addition to the larger
rectangle, a smaller rectangle has appeared. If the disparity
estimate were to run in the ``forward'' direction, then this block
would be invisible. This is because it is based upon the
derivative of the local phase of the left panel where the small block does
not appear. In the ``reverse'' direction, however, the small block shows up. To remedy this, a pseudo-average is taken,
|  |
(31) |
where  and
and  are
the disparities in the forward and reverse directions,
respectively. The minus sign reverses the direction of the second
disparity model to bring it into accordance with the first. Note that the block has no coherent
direction as shown in the enlargement in figure
 ![[*]](http://sepwww.stanford.edu/latex2html/cross_ref_motif.gif) .
This should not be surprising since there is no sense of direction for
something that materializes from nowhere. This
technique of pseudo-averaging the forward and reverse disparities,
however, has pitfalls. The image resulting from a single disparity
estimate depends on the location of the original image. If the
disparity between the images is too large, the forward and reverse
will not coincide properly causing a ``shadow'' effect.
.
This should not be surprising since there is no sense of direction for
something that materializes from nowhere. This
technique of pseudo-averaging the forward and reverse disparities,
however, has pitfalls. The image resulting from a single disparity
estimate depends on the location of the original image. If the
disparity between the images is too large, the forward and reverse
will not coincide properly causing a ``shadow'' effect.
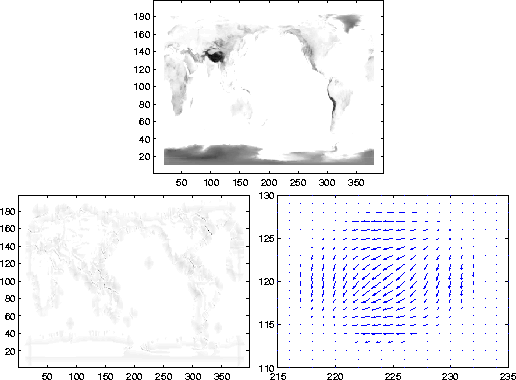
A map of the
world is shown in figure ![[*]](http://sepwww.stanford.edu/latex2html/cross_ref_motif.gif) . This image was subsequently
shifted one percent to the west and two percent to the south. A clear
disparity is shown on the bottom panel of figure
. This image was subsequently
shifted one percent to the west and two percent to the south. A clear
disparity is shown on the bottom panel of figure ![[*]](http://sepwww.stanford.edu/latex2html/cross_ref_motif.gif) . In
figure
. In
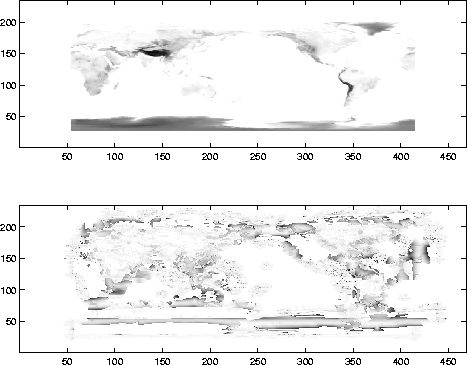
figure ![[*]](http://sepwww.stanford.edu/latex2html/cross_ref_motif.gif) , the same image is shown. The shift, however,
is 15 percent to the east and 30 percent to the north. The shadow
caused by the pseudo-average is clearly visible. There are two
disparities that are equal but vary in position based upon where their
respective image 1's were located. This pseudo-average has advantages, but for the purposes of this
paper only the forward will be used from this point forward.
, the same image is shown. The shift, however,
is 15 percent to the east and 30 percent to the north. The shadow
caused by the pseudo-average is clearly visible. There are two
disparities that are equal but vary in position based upon where their
respective image 1's were located. This pseudo-average has advantages, but for the purposes of this
paper only the forward will be used from this point forward.
world
Figure 4 Top row: A map of the world. This
image has been shifted one percent to the west and two percent to
the south.Bottom row: the magnitude of the
shift and a vector plot of the shift of the Big Island of Hawaii.


 world1
Figure 5 Top row: a map of the world.
This will be shifted 15 percent to the east and 30 percent to the north. Bottom: The shadow effect caused by
applying the pseudo-average for a large shift. Notice that there
appears to be two disparity images varying only by a shift.


Next: Applications
Up: Witten: Quaternion-based Signal Processing
Previous: Quaternionic Disparity Estimation
Stanford Exploration Project
4/5/2006

![[*]](http://sepwww.stanford.edu/latex2html/cross_ref_motif.gif) shows an instructive example with a shifted rectangular block.
The upper left panel is the original block position while the upper right panel
shows the same block shifted down and to the right by one point. On the bottom, the disparity is shown as both a
magnitude and
vector plot of the shift.
shows an instructive example with a shifted rectangular block.
The upper left panel is the original block position while the upper right panel
shows the same block shifted down and to the right by one point. On the bottom, the disparity is shown as both a
magnitude and
vector plot of the shift.


![[*]](http://sepwww.stanford.edu/latex2html/cross_ref_motif.gif) is similar to
figure
is similar to
figure ![[*]](http://sepwww.stanford.edu/latex2html/cross_ref_motif.gif) except that, in addition to the larger
rectangle, a smaller rectangle has appeared. If the disparity
estimate were to run in the ``forward'' direction, then this block
would be invisible. This is because it is based upon the
derivative of the local phase of the left panel where the small block does
not appear. In the ``reverse'' direction, however, the small block shows up. To remedy this, a pseudo-average is taken,
except that, in addition to the larger
rectangle, a smaller rectangle has appeared. If the disparity
estimate were to run in the ``forward'' direction, then this block
would be invisible. This is because it is based upon the
derivative of the local phase of the left panel where the small block does
not appear. In the ``reverse'' direction, however, the small block shows up. To remedy this, a pseudo-average is taken,
![[*]](http://sepwww.stanford.edu/latex2html/cross_ref_motif.gif) .
This should not be surprising since there is no sense of direction for
something that materializes from nowhere. This
technique of pseudo-averaging the forward and reverse disparities,
however, has pitfalls. The image resulting from a single disparity
estimate depends on the location of the original image. If the
disparity between the images is too large, the forward and reverse
will not coincide properly causing a ``shadow'' effect.
.
This should not be surprising since there is no sense of direction for
something that materializes from nowhere. This
technique of pseudo-averaging the forward and reverse disparities,
however, has pitfalls. The image resulting from a single disparity
estimate depends on the location of the original image. If the
disparity between the images is too large, the forward and reverse
will not coincide properly causing a ``shadow'' effect.
![[*]](http://sepwww.stanford.edu/latex2html/cross_ref_motif.gif) . This image was subsequently
shifted one percent to the west and two percent to the south. A clear
disparity is shown on the bottom panel of figure
. This image was subsequently
shifted one percent to the west and two percent to the south. A clear
disparity is shown on the bottom panel of figure ![[*]](http://sepwww.stanford.edu/latex2html/cross_ref_motif.gif) . In
figure
. In
figure ![[*]](http://sepwww.stanford.edu/latex2html/cross_ref_motif.gif) , the same image is shown. The shift, however,
is 15 percent to the east and 30 percent to the north. The shadow
caused by the pseudo-average is clearly visible. There are two
disparities that are equal but vary in position based upon where their
respective image 1's were located. This pseudo-average has advantages, but for the purposes of this
paper only the forward will be used from this point forward.
, the same image is shown. The shift, however,
is 15 percent to the east and 30 percent to the north. The shadow
caused by the pseudo-average is clearly visible. There are two
disparities that are equal but vary in position based upon where their
respective image 1's were located. This pseudo-average has advantages, but for the purposes of this
paper only the forward will be used from this point forward.

