![[*]](http://sepwww.stanford.edu/latex2html/cross_ref_motif.gif) ). This may not occur if the background velocity in the
medium varies so strongly with midpoint as to distort these shapes too
much.
). This may not occur if the background velocity in the
medium varies so strongly with midpoint as to distort these shapes too
much.
![[*]](http://sepwww.stanford.edu/latex2html/cross_ref_motif.gif) ). At a closer inspection, the
affected areas show traveltime departures from hyperbolicity as small
as 2-3 ms Carazzone et al. (1984) and as large as 20 ms
Kjartansson (1979). An
illustration of these effects is presented in the middle panel of
Figure
). At a closer inspection, the
affected areas show traveltime departures from hyperbolicity as small
as 2-3 ms Carazzone et al. (1984) and as large as 20 ms
Kjartansson (1979). An
illustration of these effects is presented in the middle panel of
Figure ![[*]](http://sepwww.stanford.edu/latex2html/cross_ref_motif.gif) . The amplitudes in these areas may be easily
three times larger than those in unaffected areas White et al. (1988). The
effects may be frequency-dependent and distort the wavelet
Stephens and Sheng (1985); Vlad and Biondi (2002).
. The amplitudes in these areas may be easily
three times larger than those in unaffected areas White et al. (1988). The
effects may be frequency-dependent and distort the wavelet
Stephens and Sheng (1985); Vlad and Biondi (2002).
|
Needed: modeling of purely-velocity and purely-absorption FEAVO, in order to investigate whether the frequency-dependent effects can serve to discriminate between FEAVO caused by absorption and that caused by velocity. |
While the above-described effects are visible and are what started
FEAVO research in the seventies, FEAVO's certain ``signature'' in the data
domain (before migration) is the ``Kjartansson V's''. These
shapes appear if we window a prestack 2-D line to roughly include the
areas with anomalous amplitudes, then take the absolute value of each
sample, stack the prestack dataset along the time axis and
display the resulting midpoint-offset plot with an appropriate
gain. ``V'' shapes become visible (right panel in Figure
![[*]](http://sepwww.stanford.edu/latex2html/cross_ref_motif.gif) ). This may not occur if the background velocity in the
medium varies so strongly with midpoint as to distort these shapes too
much.
). This may not occur if the background velocity in the
medium varies so strongly with midpoint as to distort these shapes too
much.
 |
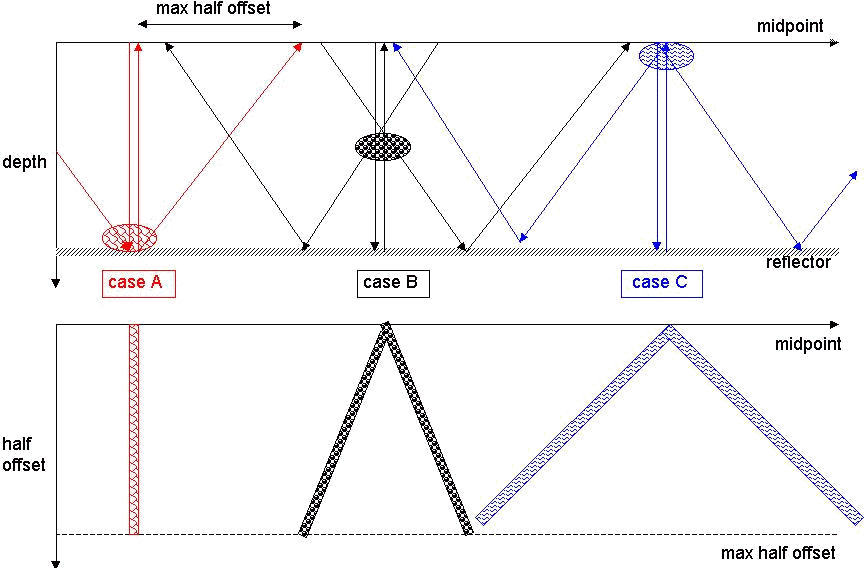
The heuristic used by Kjartansson (1979) to explain the
formation of the ``V'' shapes is presented in Figure ![[*]](http://sepwww.stanford.edu/latex2html/cross_ref_motif.gif) .
.
 |
| |
(1) |
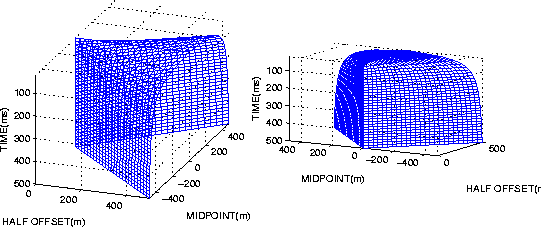
![[*]](http://sepwww.stanford.edu/latex2html/cross_ref_motif.gif) gives a better view of the path of the FEAVO
effects through the prestack dataset. The shape resembles the bow of a
capsized boat. Its slope becomes asymptotically vertical with
time and the opening of the ``V''s becomes asymptotically
gives a better view of the path of the FEAVO
effects through the prestack dataset. The shape resembles the bow of a
capsized boat. Its slope becomes asymptotically vertical with
time and the opening of the ``V''s becomes asymptotically  |
A subtle, little-studied aspect of FEAVO effects is the distribution of the anomalous amplitudes when the anomaly paths described above intersect reflectors, for which I will use the name ``FEAVO microstructure''. Since an absorption-free, velocity-only ``lens'' conserves energy, any increase in amplitudes would have to be bordered by one or two shadow zones, and a decrease - by two illuminated zones. Finite-frequency wave theory predicts this for absorption-free media and ultrasonic experiments confirm it, as illustrated by Figure 4 of Spetzler et al. (2004). I am not aware of any equivalent studies for absorption. The existence or not of shadow/hightlight border zones for absorption is important because it may offer an avenue of discriminating between absorption-caused FEAVO and velocity-caused FEAVO, a key issue when trying to remove focusing with methods based on the physics of the phenomena (not just image processing).
|
Needed: A theoretic/numeric study of the magnitude of the shadow/highlight efects bordering FEAVO with parameters likely to be encountered in real exploration surveys, including absorption. |
The polarity of the FEAVO on a reflector depends on the polarity of
the velocity anomaly causing the FEAVO (negative or positive with
respect to the background) and on the polarity of
the reflector itself. The rightmost ``V'' in the bottom panel of
Figure ![[*]](http://sepwww.stanford.edu/latex2html/cross_ref_motif.gif) illustrates the dependence of the polarity of the
``V''s on the sign of the velocity anomaly.
illustrates the dependence of the polarity of the
``V''s on the sign of the velocity anomaly.![[*]](http://sepwww.stanford.edu/latex2html/foot_motif.gif) This will have important
consequences on the choice of FEAVO removal strategies, treated in a
separate section towards the end of this paper.
This will have important
consequences on the choice of FEAVO removal strategies, treated in a
separate section towards the end of this paper.