


![[*]](http://sepwww.stanford.edu/latex2html/cross_ref_motif.gif) shows a 3D Elf North Sea data set. Marked by considerable folding and a sharp angular unconformity, this data presents a formidable flattening challenge.
shows a 3D Elf North Sea data set. Marked by considerable folding and a sharp angular unconformity, this data presents a formidable flattening challenge.
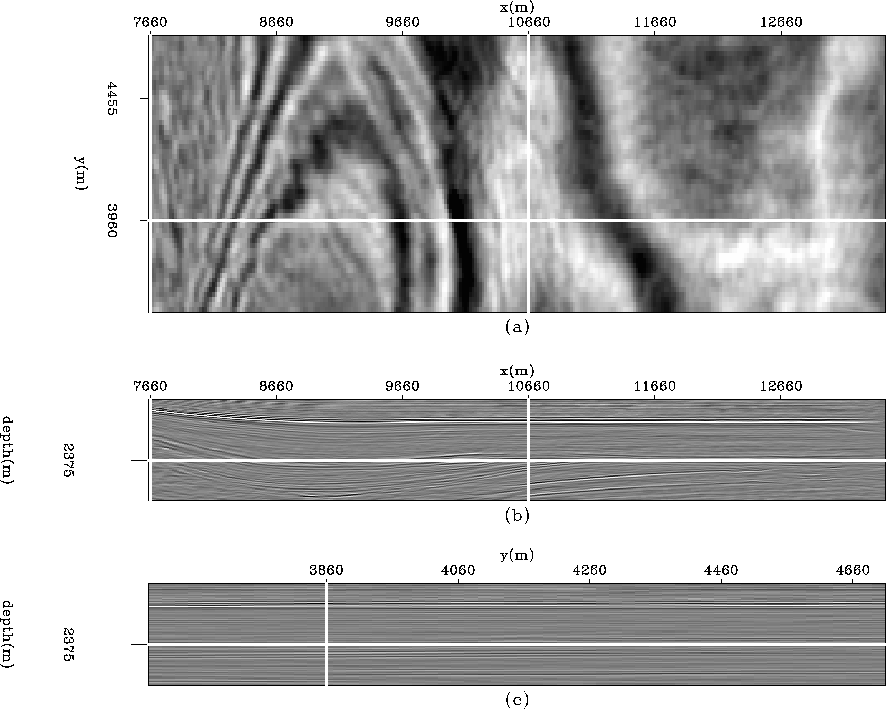
The flattening result is shown in Figure . In order to preserve the continuity of the data, we used a smoothing parameter ![]() of 1.0 in equation (10). Thus, it is no surprise that the result is not completely flat. Had we used an
of 1.0 in equation (10). Thus, it is no surprise that the result is not completely flat. Had we used an ![]() of 0.0, the data would be flatter but would lose its continuity. Consequently, the trade-off between continuity and flatness emerges in cases of pinch-outs and unconformities. Notice that at the bottom of the section, there are some discontinuities introduced by the flattening process.
of 0.0, the data would be flatter but would lose its continuity. Consequently, the trade-off between continuity and flatness emerges in cases of pinch-outs and unconformities. Notice that at the bottom of the section, there are some discontinuities introduced by the flattening process.
When it comes to overlaying the picks on the data, an ![]() of 0.0 is preferable. The results are shown in Figure . The time slice at the top shows the swaths of two different horizons. Overall, the picked horizons track up to and along the unconformity. The only significant errors occur where the data quality is questionable and, as a result, the estimated dip is inaccurate.
of 0.0 is preferable. The results are shown in Figure . The time slice at the top shows the swaths of two different horizons. Overall, the picked horizons track up to and along the unconformity. The only significant errors occur where the data quality is questionable and, as a result, the estimated dip is inaccurate.
 |


 |
. This image illustrates the trade-off between data continuity preservation and flatness. We used a smoothing parameter
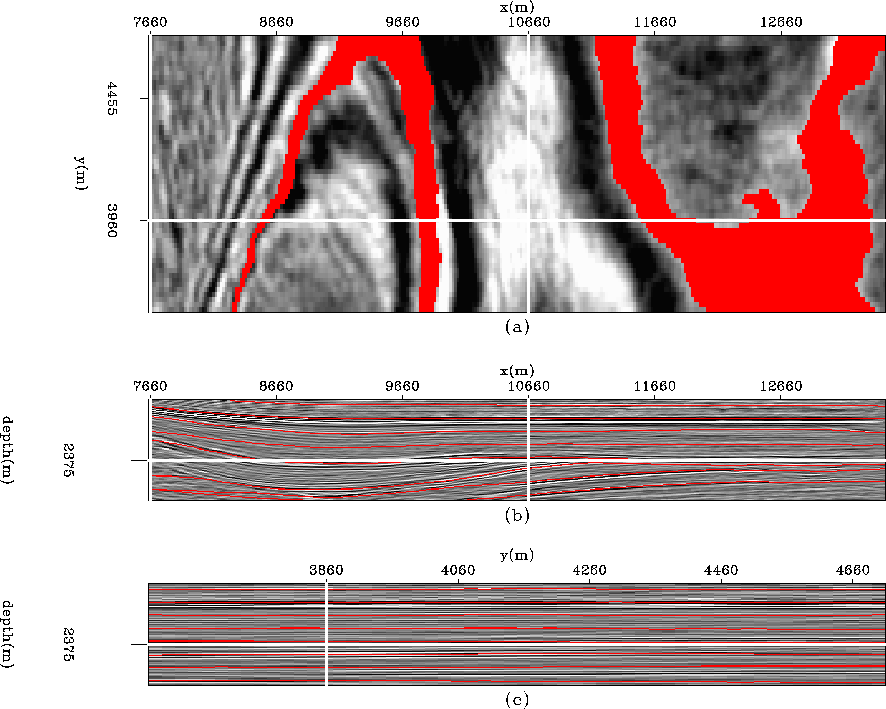 |
. Because the smoothing parameter