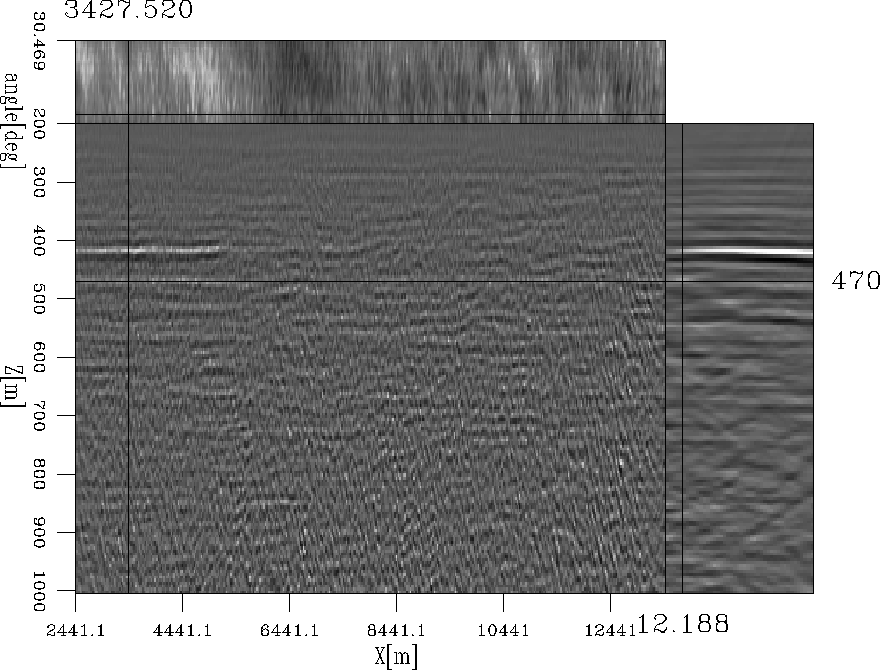
Velocity departures from the
background can be seen in the left panel of Figure
5 as residual curvatures in angle-domain common
image gathers (ADCIGs). This figure contains only the angles between
![]() and
and ![]() . Because of the small depth of the
thermohaline reflections and of the missing near-offset information,
information from incidence angles smaller than
. Because of the small depth of the
thermohaline reflections and of the missing near-offset information,
information from incidence angles smaller than ![]() was
obtained only from the offset-continuation fill. We discarded it,
since it was characterized completely by our estimate of constant velocity.
The angles larger than
was
obtained only from the offset-continuation fill. We discarded it,
since it was characterized completely by our estimate of constant velocity.
The angles larger than ![]() were unusable because of a loss
of bandwidth during the transformation to ADCIGs. The small curvatures
place the velocity anomalies well within the limits of the Born
approximation. This means that WEMVA would be a suitable tool for
resolving them.
were unusable because of a loss
of bandwidth during the transformation to ADCIGs. The small curvatures
place the velocity anomalies well within the limits of the Born
approximation. This means that WEMVA would be a suitable tool for
resolving them.
WEMVA is an iterative inversion scheme that attempts to optimize the focusing of the migrated image Biondi and Sava (1999). Specifically, the result of wavefield-continuation migration is transformed to ADCIGs, the gathers are flattened, the difference from the unflattened image is taken to obtain an image perturbation, which is finally inverted into a velocity update. We plan to perform this procedure in the future, using moveout shifts computed by dip field integration Guitton (2003a) to flatten the gathers for the image perturbation.
 |
|
Cuben4aT
Figure 5 ADCIGs between |  |