


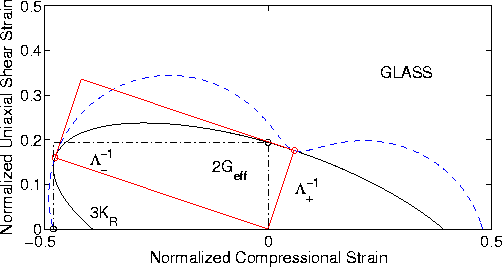
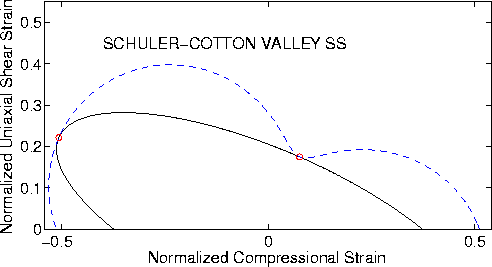
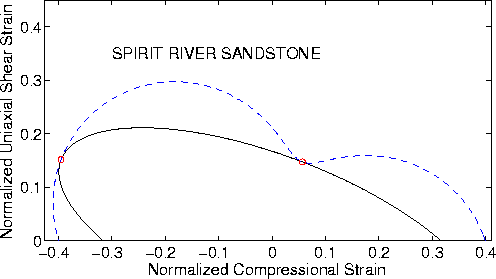
To clarify the situation, we show some examples in Figures 1-8. The details of the analysis that produces these figures are summarized in the Appendix. The main point is that, for the compliance version of the analysis, the contours of constant energy are ellipses when the vector f in (18) is interpreted as a stress. Analogously, when the vector is treated as a strain, the contours of constant energy are ellipses for the dual (or stiffness) formulation. If we choose to think of these figures as diagrams in the complex plane, then we note that -- while circles and lines transform to circles and lines when transforming back and forth between these two planes -- the shapes of ellipses are not preserved (except, of course, in the special case - which is precisely that of isotropy - when the ellipses degenerate to circles). Eigenvectors are determined by the directions in which the points of contact of these two curves lie (indicated by red circles).
 |

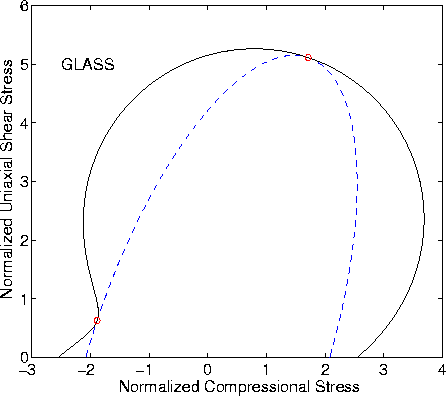 |
Figures 1 and 2 present an example based on a glassy material.
Typical values for the bulk and shear moduli of glass were used:
Km = 46.3 GPa and Gm = 30.5 GPa, respectively. The value
of the Biot-Willis coefficient was arbitrarily chosen as ![]() ,so Kdr = 18.52 GPa. Taking Poisson's ratio as
,so Kdr = 18.52 GPa. Taking Poisson's ratio as ![]() , we
have Gdr = 13.89 GPa. Skempton's coefficient was chosen for
simplicity to be
, we
have Gdr = 13.89 GPa. Skempton's coefficient was chosen for
simplicity to be ![]() in this and all the other examples as well.
(This choice is extreme because it implies that Ku = Km. But,
since our interest here is in analysis of the undrained shear modulus,
the study of this limit is particularly useful to us.)
The most anisotropic choices of
in this and all the other examples as well.
(This choice is extreme because it implies that Ku = Km. But,
since our interest here is in analysis of the undrained shear modulus,
the study of this limit is particularly useful to us.)
The most anisotropic choices of ![]() and
and ![]() were
used that would not produce absurd (negative) values of the diagonal
coefficients for either s*ij or c*ij, and that also would
not produce Gu > Gm. [Gu determined by (32) amd (33) is a
type of upper bound - actually the Voigt average. Values of this
bound that might exceed Gm need not be considered.] For glass,
these values were found to be
were
used that would not produce absurd (negative) values of the diagonal
coefficients for either s*ij or c*ij, and that also would
not produce Gu > Gm. [Gu determined by (32) amd (33) is a
type of upper bound - actually the Voigt average. Values of this
bound that might exceed Gm need not be considered.] For glass,
these values were found to be ![]() and
and
![]() .The value of the energy used for normalization was U = 900.0 GPa.
Computed values for the effective and undrained
shear moduli were Geff = 25.43 GPa and Gu = 15.28 GPa.
.The value of the energy used for normalization was U = 900.0 GPa.
Computed values for the effective and undrained
shear moduli were Geff = 25.43 GPa and Gu = 15.28 GPa.
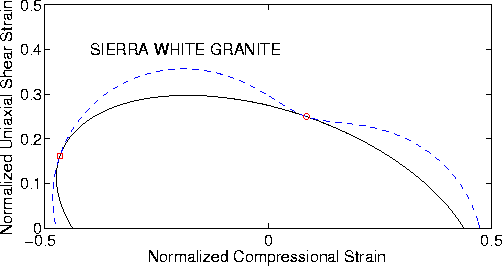
For the remaining three sets of examples, the values used for the moduli of the samples are taken from results contained in Berryman (2004a), wherein it was shown how certain laboratory data could be fit using an elastic differential effective medium scheme. These results are summarized in the TABLE.
 |
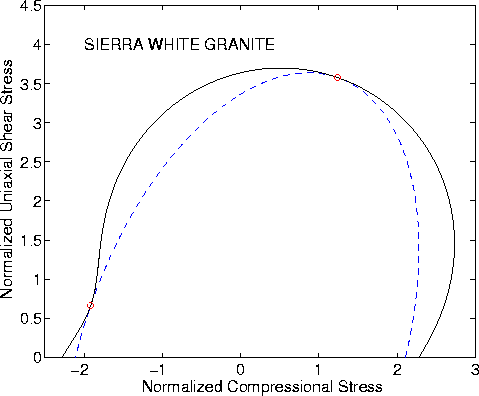 |
Figures 3 and 4 present results for Sierra White granite.
Laboratory data on this material were presented by Murphy (1982).
The values chosen for ![]() and
and ![]() were
were
![]() and
and ![]() .The value of the energy used for normalization was
.The value of the energy used for normalization was
![]() GPa. Computed values for the effective and undrained
shear moduli were Geff = 39.8 GPa and Gu = 28.3 GPa.
GPa. Computed values for the effective and undrained
shear moduli were Geff = 39.8 GPa and Gu = 28.3 GPa.
 |
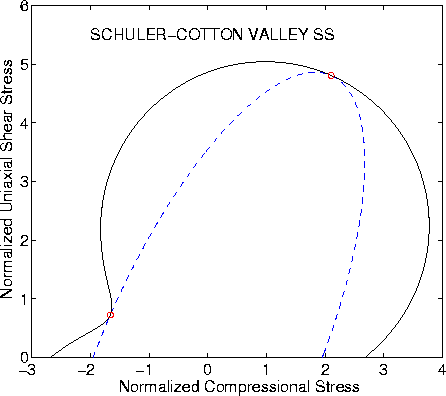 |
Figures 5 and 6 present results for Schuler-Cotton Valley sandstone.
Laboratory data on this material were also presented by Murphy (1982).
The values chosen for ![]() and
and ![]() were
were
![]() and
and ![]() .The value of the energy used for normalization was
.The value of the energy used for normalization was
![]() GPa. Computed values for the effective and undrained
shear moduli were Geff = 35.8 GPa and Gu = 17.7 GPa.
GPa. Computed values for the effective and undrained
shear moduli were Geff = 35.8 GPa and Gu = 17.7 GPa.
 |
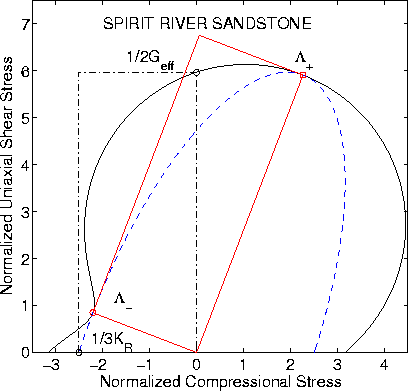 |
Figures 7 and 8 present results for Spirit River sandstone.
Laboratory data on this material were presented by Knight and
Nolen-Hoeksema (1990). The values chosen for ![]() and
and ![]() were
were
![]() and
and ![]() .The value of the energy used for normalization was
.The value of the energy used for normalization was
![]() GPa. Computed values for the effective and undrained
shear moduli were Geff = 20.11 GPa and Gu = 12.41 GPa.
GPa. Computed values for the effective and undrained
shear moduli were Geff = 20.11 GPa and Gu = 12.41 GPa.