 |
Figure 7 Snapshot of the source wavefield in the Marmousi velocity model using (a) the traditional surface boundary condition, (b) Zhang's surface boundary condition, and (c) the new surface boundary condition.
The Marmousi synthetic data set Bourgeois et al. (1991) was first released as a blind test for velocity estimation. It has become a popular testbed for migration algorithms. Its structural style is dominated by growth faults, which arise from salt creep and give rise to the complicated velocity structure in the upper part of the model.
Figure 7 shows a comparison of three snapshots in the (x,z) plane of the source wavefield, computed using the three different surface boundary conditions in the Marmousi model. The extrapolation method used was split-step with 7 reference velocities Stoffa et al. (1990). In the Marmousi model, the wavefront amplitude should not be homogeneous with the propagation angle. This is because of the complexity of the velocity model.
 |
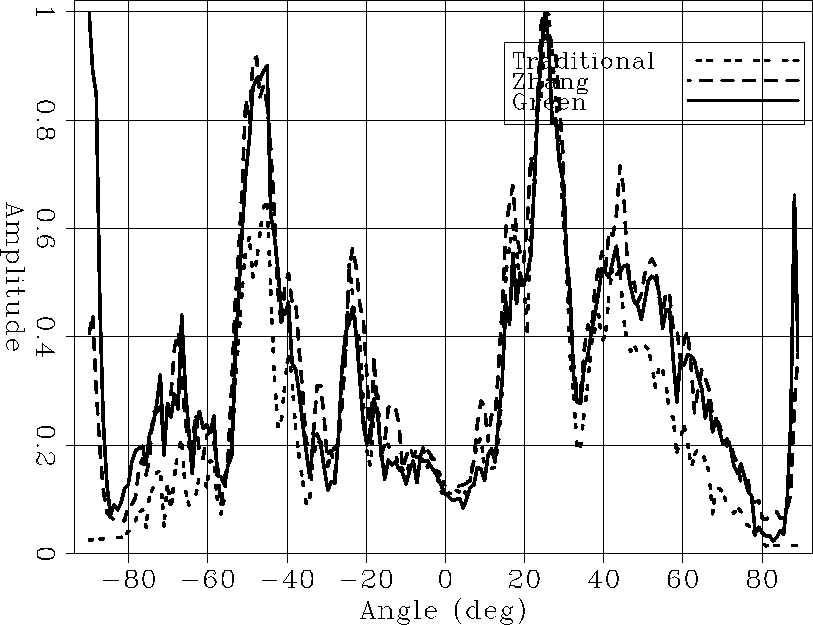
Figure 8 shows a comparison of the amplitudes along the wavefront depending on the polar angle (polar system center at the shot position). We can see that the amplitudes along the wavefront have a complex behavior. In general, for the traditional surface boundary condition (dotted curve), the wavefront shows lower amplitudes at higher angles than do the curves corresponding to Zhang's surface boundary condition (dashed curve) and the proposed surface boundary condition (solid curve).
|
comp_max_Marm
Figure 8 Amplitudes along the wavefields in the Marmousi velocity model. |  |
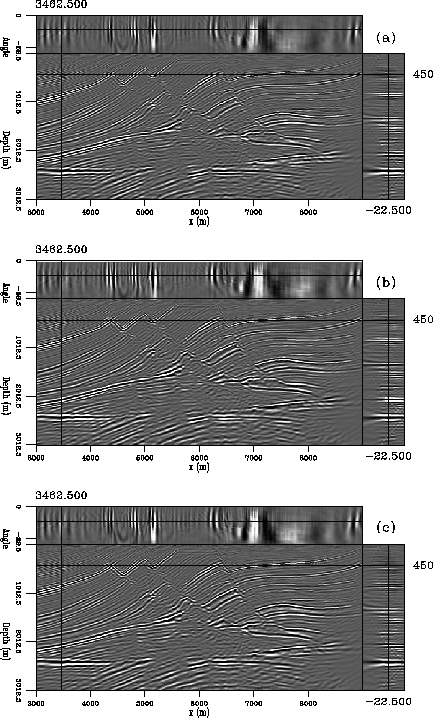
We migrated the Marmousi model data with a split-step algorithm using 7 reference velocities. Figures 9a and 10a show the image obtained using the traditional surface boundary condition, figures 9b and 10b show the image obtained using Zhang's surface boundary condition, and figures 9c and 10c show the image obtained using the new surface boundary condition. Both figure 9b (10b) and figure 9c (10c) show steep dips more accurately than 9a (10a).
 |
 |