

Next: CONCLUSIONS
Up: SQUIRT-FLOW MODEL
Previous: Squirt Flow Modeling Choices
nosquirt
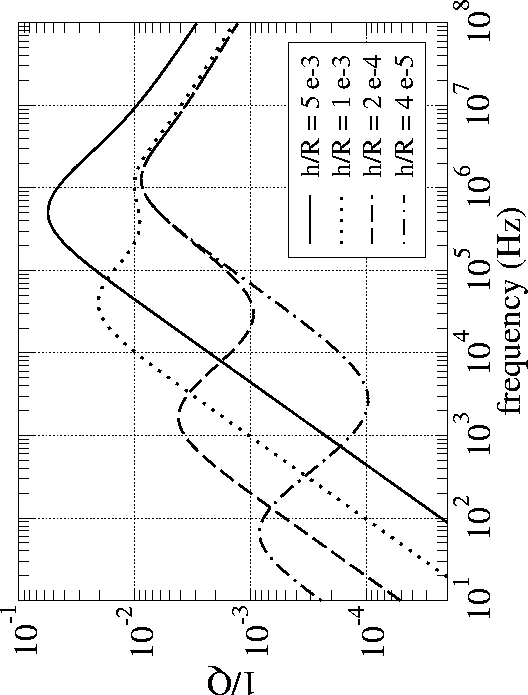
Figure 4 The squirt-flow model of P-wave attenuation
when the grains are modeled as being spherical of radius R
and containing microcracks having effective aperatures h.
The overall drained modulus of the rock corresponds to
a consolidated sandstone.

In Fig. 4,
we plot the P-wave attenuation
predicted using the above model when the overall grain packing corresponds
to a consolidated sandstone (v1=0.2 and c=5)
having a permeability of 10 mD. For the grain properties we take
 ,
3Nc /(4NR2) = 1, and Ks = 38 GPa (quartz) as fixed constants.
This
  value was chosen so that there would be an important
peak in attenuation
at ultrasonic frequencies and is taken to be the same for all values
of h/R. The various curves can be thought of as being due to
the application of effective stress.
The peak in Q-1 near 1 MHz that is
invariant to h/R is that due to the macroscopic
Biot loss (fluid pressure equilibration at the scale of the wavelength).
The peak that shifts with h/R is that due to the squirt flow.
This figure indicates
that although the squirt mechanism is probably
operative and perhaps even dominant at ultrasonic frequencies,
it does not seem to be involved in explaining
the observed levels of intrinsic attenuation in exploration work.
For real cracks inside of real grains, the
 value will diminish with effective stress (i.e., with h/R),
so that the effects of squirt in the seismic band are likely to be even less
than shown in Fig. 4.
pridedvorkin
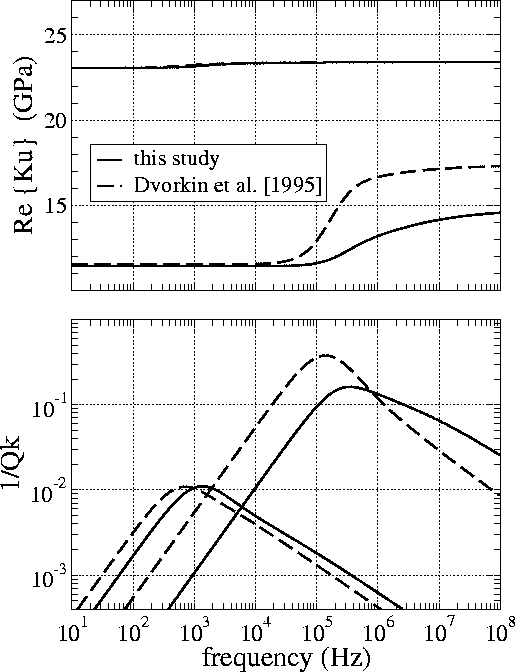
Figure 5 The undrained bulk modulus
 in the squirt model of the present study
and in the model of Dvorkin et al. (1995).
The top graph is
  while the bottom graph is
 . The frame properties
are the same as in Fig. 4.
The curves having a smaller relaxation frequency (
 Hz)
and almost no dispersion correspond to
  while the curves having the larger critical frequency (
 Hz) and more dispersion correspond to
  .
.

We next introduce the grain parameters k2,  , and
Kd2 as modeled here along with the same overall drained modulus K
into the model of Dvorkin et al. (1995) and compare
the results to our own model for two different values of
h/R (Fig. 5). Although both models have similar dependencies
on the various material properties involved,
there are nonetheless significant differences. These are
principally due to
the fact that the Dvorkin et al. (1995) model requires the grains
to be in the form of effective cylinders of radius R, while in
Fig. 5
we use a geometric parameter L2 and volume-to-surface ratio
V/S that are appropriate for
spherically-shaped grains. However, in various limits as the frequency
and/or fluid bulk modulus become either large or small, we have verified that
both models yield qualitatively similar results.


Next: CONCLUSIONS
Up: SQUIRT-FLOW MODEL
Previous: Squirt Flow Modeling Choices
Stanford Exploration Project
10/14/2003

