 |
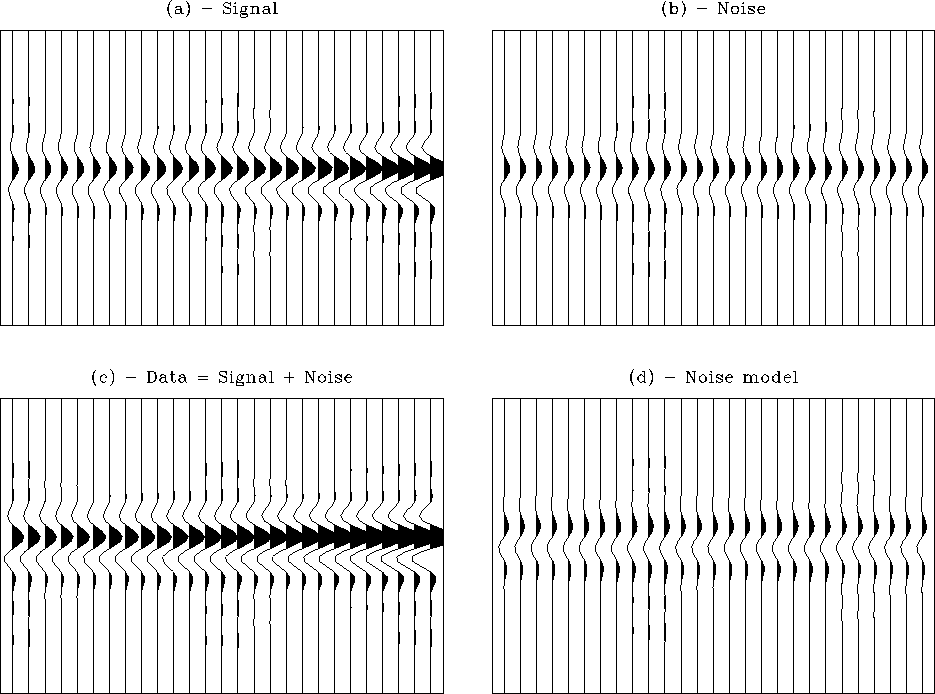
Figure 1 (a) A linear event, the signal, with a gradient of 1.05. (b) A linear event, the noise, with constant amplitude. (c) The sum of (a)+(b), the data. (d) A noise model obtained after applying a phase-shift to (b).
In Figure 1a, the signal, I show a linear event with a gradient of 1.05 from trace to trace. Figure 1b, the noise, displays another linear event with constant amplitude that perfectly overlaps with Figure 1a. The sum of Figures 1a and 1b gives Figure 1c, the data.
To make matters worse, I applied a phase-shift to the noise in order to compute the noise model (Figure 1d). My goal is to adaptively subtract this noise model from the data in Figure 1c in order to retrieve the signal in Figure 1a.
 |
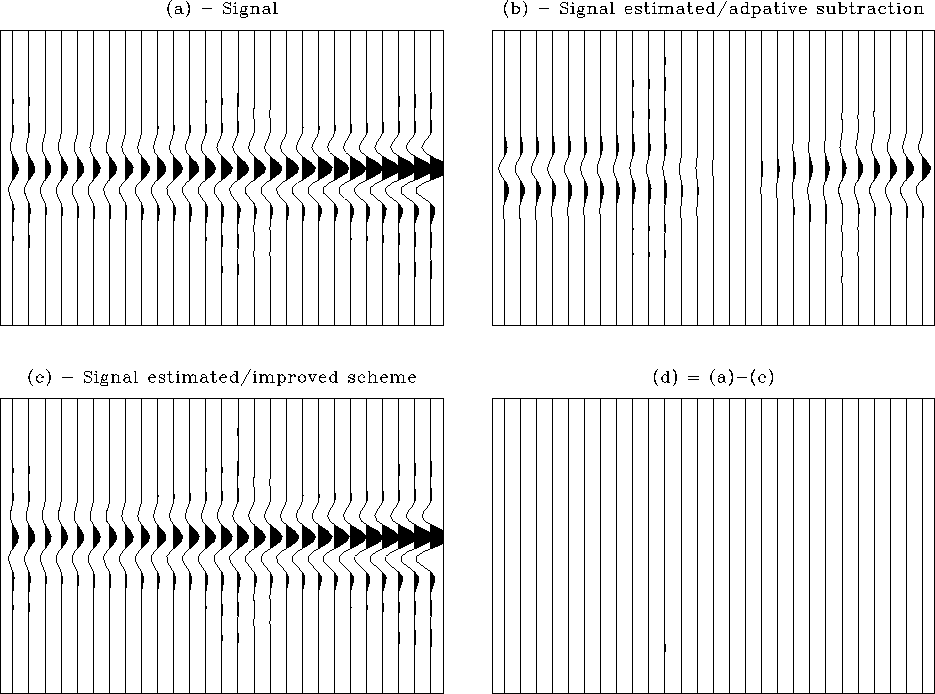
Now I estimate the filter with the standard approach and compute the signal in Figure 2b. The estimated signal clearly does not resemble the true signal in Figure 1a.
The hybrid method gives a perfect result. First I estimate
a pef with two coefficients for the signal by deconvolving the data pef
by the noise pef. I obtain for the signal pef ![]() .Then I estimate the matched-filter with the hybrid approach and
compute the signal in Figure 2c. The separation
is perfect as shown in the difference panel in Figure
2d.
.Then I estimate the matched-filter with the hybrid approach and
compute the signal in Figure 2c. The separation
is perfect as shown in the difference panel in Figure
2d.
 |
In the next section I show prestack land data examples.