We ran four prestack depth migrations, one for four possible permutations of converted waves. For the ``PPPP'' migration, we image the usual P-wave reflections, using the velocity of Figure 1. In the ``PSSP'' migration, we image waves which convert from P to S at the top of basalt, reflect as S, then convert back to P at the top of basalt. The PSSP waves are ``symmetric'', meaning that by simply replacing compressional wave velocity with an estimate of shear wave velocity below the basalt, we can image these waves with conventional methods Gratwick (2000). We simply scaled the velocity model shown in Figure 1 by 0.6 (corresponding to a Vp/Vs ratio of roughly 1.7) below the top basalt. The last two migrations image the ``asymmetric'' converted waves, ``PSPP'' and ``PPSP'', or waves for which only one leg of the source-to-receiver raypath contains a sub-basalt conversion. Our migration code can accept different velocity functions for the source-to-reflector and reflector-to-receiver legs of the downward continuation.
Since in all migrations, we assume P-wave propagation from source to top of basalt and from top of basalt to the receiver, we datumed the prestack data to 1200 meters, just above the top of basalt.
Figure 2 shows a Cubeplot view of a constant-ph PPPP migration.
The interpreted base basalt reflection is just below 3000 m at this CMP (see Figure 1).
On the ph gather, we see a strong reflection around 3000 m, although it has quite a bit of
curvature, meaning it is imaged with too high a velocity. On a time-migrated section (not shown),
we interpret this as a likely internal
multiple; one that takes an extra bounce between the top basalt and water bottom (event 2 on
Figure 3). The depth slice is taken through the top basalt reflection; notice
critical angle behavior around ph=0.0004. Given the velocity of 2800 m/s just under top
basalt, the predicted critical angle (![]() ) is consistent with the
estimate. Thus we can use critical angle as a rough means of validating the velocity model.
) is consistent with the
estimate. Thus we can use critical angle as a rough means of validating the velocity model.
 |
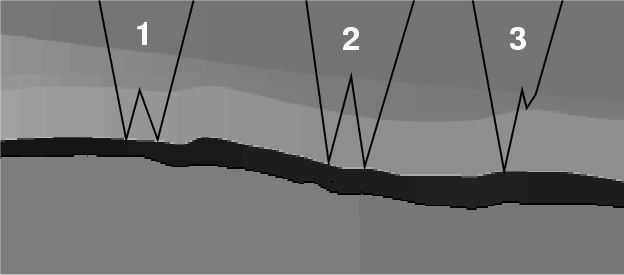 |
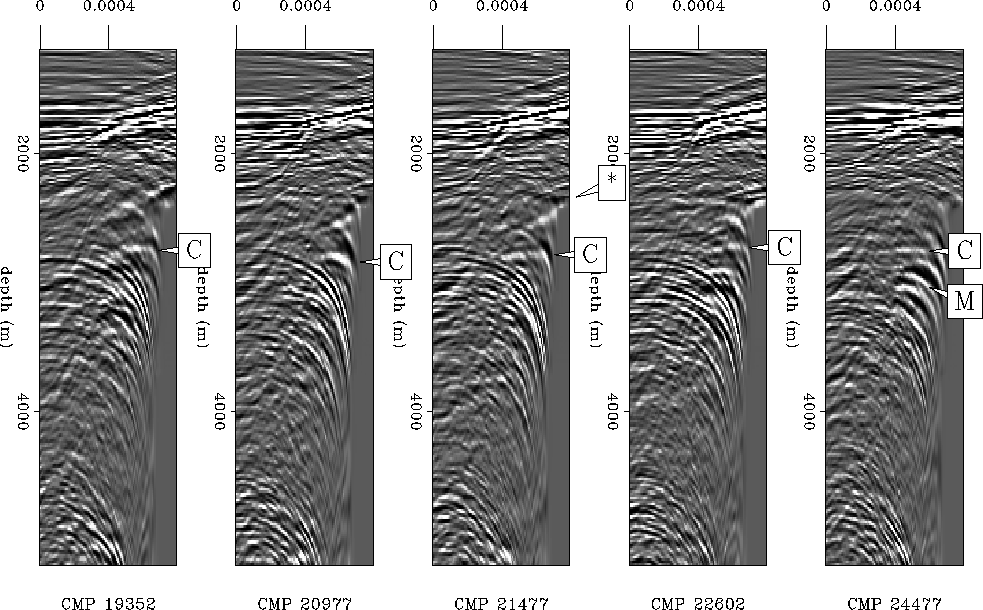
Figure 4 shows five selected ADCIGs from the PSSP migration, from CMP 19352 m to 24477 m. The package of strong, low-velocity events is interpreted as the top basalt water layer multiple (one bounce). However, at a depth of about 2700 m on all gathers we notice two persistent, fast events which occurs only at high ph. The deeper of the two (marked ``C'') is fairly flat, while the shallower one (marked ``*'') has a higher apparent velocity, and thus curves upward. At CMP 24477, notice a package of strong events (marked ``M'') with higher velocity than the obvious multiples below, but still not flat. Initially, we thought these events might be converted waves, but on a time-migrated section, we noted that the events have the same character as top basalt and the correct time delay to be a top basalt/water bottom internal multiple (event 2 on Figure 3). Since the events marked ``C'' seem to be independent from these probable internal multiples, we are confident in our interpretation of these events as real PSSP reflections.
 |
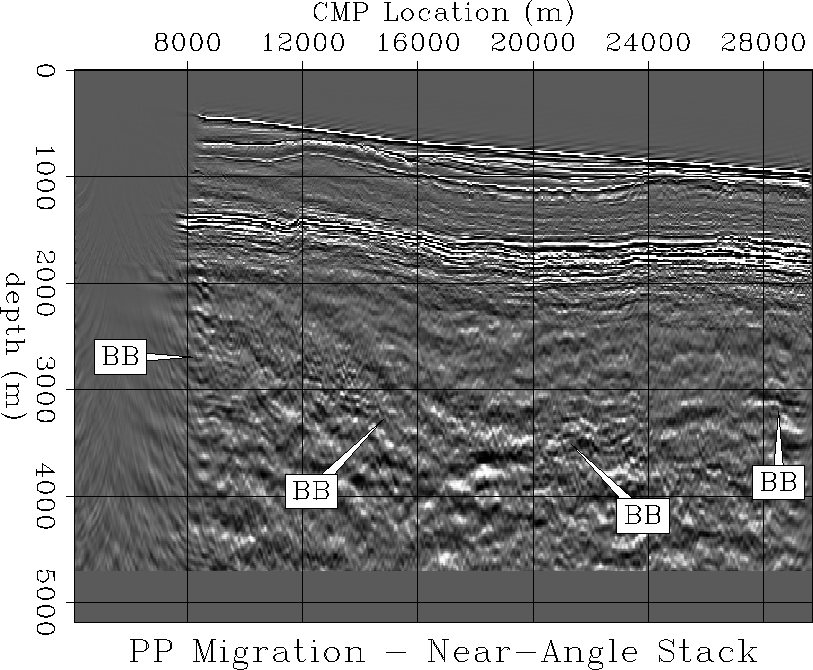
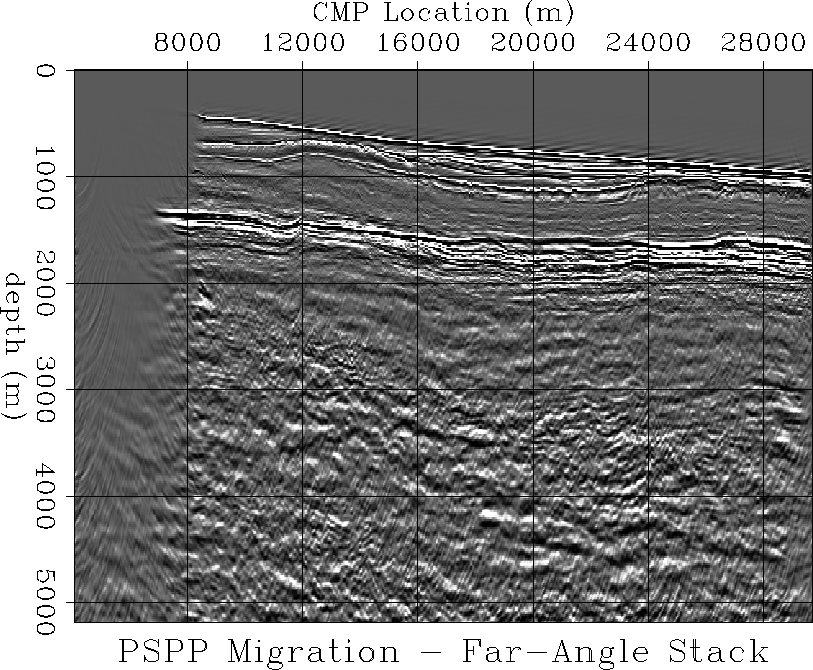
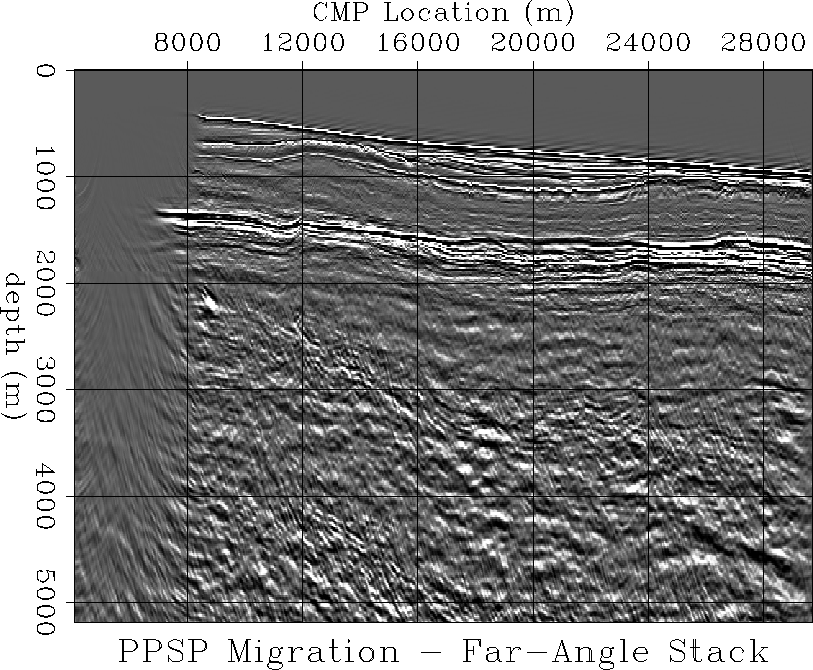
Figures 5-8 show near-angle stacks (for PPPP) and far-angle stacks (for PSSP, PSPP, and PPSP) of the four constant-ph migrations. The PPPP migration near-angle (ph = [0.0, 0.00016]) stack (Figure 5) appears to have little interpretable coherent energy below the top basalt. The signal-to-noise ratio appears highest on the right hand side of the image, and we can see a coherent event just below 3000 meters, which has been interpreted as base basalt (compare with Figure 1). A preliminary base basalt has been annotated onto the figure, but the uncertainty is quite high.
 |
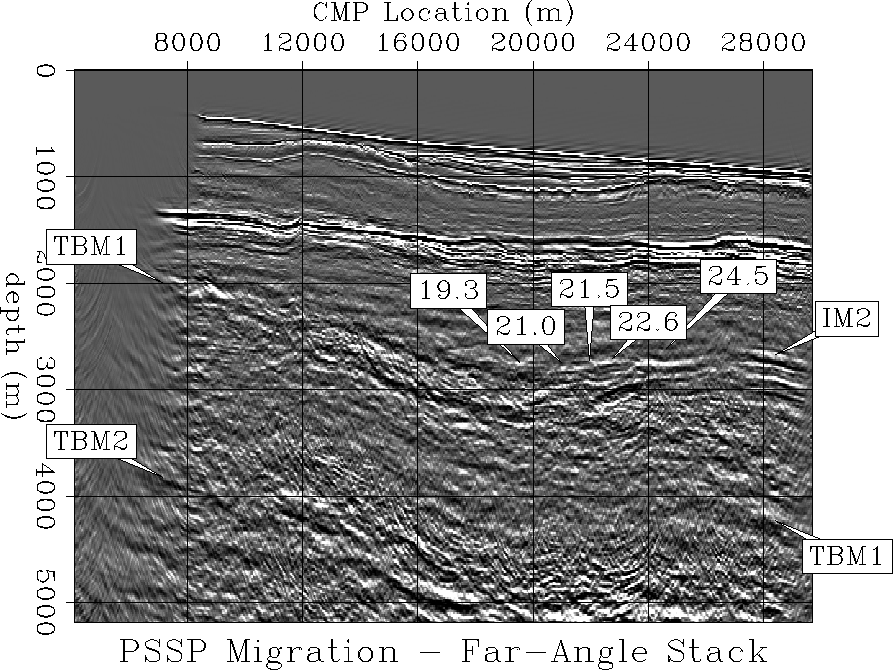
The PSSP far-angle (ph = [0.00040, 0.000696]) stack (Figure 6) has more interpretable energy, but much of it is likely due to un-suppressed multiples. The first top basalt water bottom multiple (TBM1) is readily visible, dipping down from 2000 m depth on the left to 4000 m depth on the right. The second multiple (TBM2) is visible near the bottom of the section. On the right side of the image, we have an interesting package of events, which we believe are internal multiples (labeled ``IM2''; event 2 on Figure 3), and which appear convex between CMP 24000-28000 m, and then appear to dip down between CMP 20000-24000 m. The possible sub-basalt PSSP event that we interpreted in Figure 4 is annotated with the CMP location (in kilometers) of the gathers.
 |
Time constraints prevented us from more fully interpreting the results of the far-angle (ph = [0.00016, 0.000408]) stacks of the asymmetric mode migrations (Figures 7 and 8). Still a few comparative features merit attention. We note that the first top basalt water bottom multiple focuses differently on each plot, and also a slight relative horizontal shift between the two panels. In perfunctory viewing of the migrated gathers, we saw no obvious candidates for PSPP or PPSP waves. We may not be looking in the right places, or our lack of success may underscore our need for more serious velocity analysis, or both.
 |
 |