|
plot1
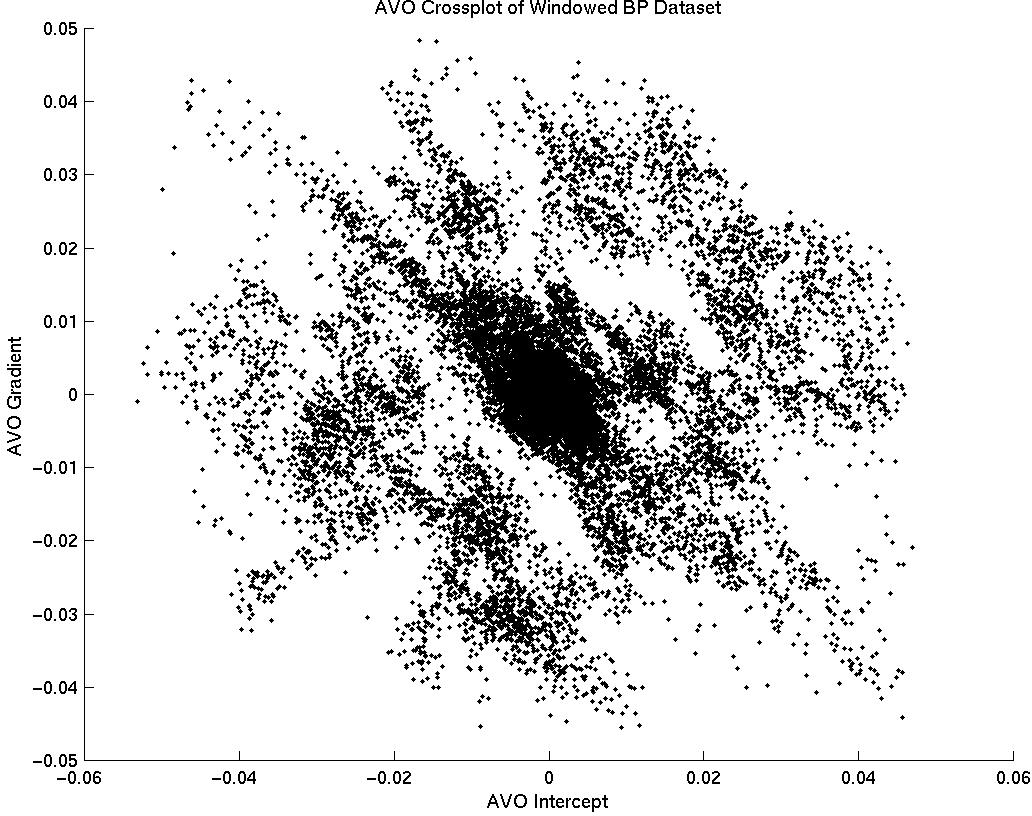
Figure 4 A vs. B scatter-plot (from synthetic image used in this study). |  |
In order to extract A and B values from the image, it must be assumed that the reflectors in the angle gathers are flat. This is because the algorithm takes amplitude values from horizontal lines on the image gathers. Getting image gathers flat is trivial for synthetic data, since the velocity function is known. For real data, getting image gathers flat is a product of good velocity analysis Yilmaz (1987). In practice, often we use the envelope of a trace, rather than the amplitude. This way, events do not need to be exactly flat. For our study, the gain in resolution of the A*B image justified using amplitude instead of envelope.
Since we don't want points in the image gather that correspond to values outside the range of our maximum Ph, a mute is applied to zero irrelevant parts of the image gathers Gratwick (2001). Figure 3 shows a hypothetical amplitude vs. offset ray parameter plot for a reflector from a Class III AVO interface. There is a simple least-squares fit to these points (zeroed amplitude values are not included), and the y-intercept of this line is the AVO intercept (A). The slope of this least-squares line is the AVO gradient (B). Thus from the image gathers, two panels are created: one for the intercept and another for the gradient.
|
plot1
Figure 4 A vs. B scatter-plot (from synthetic image used in this study). |  |
|
plot2
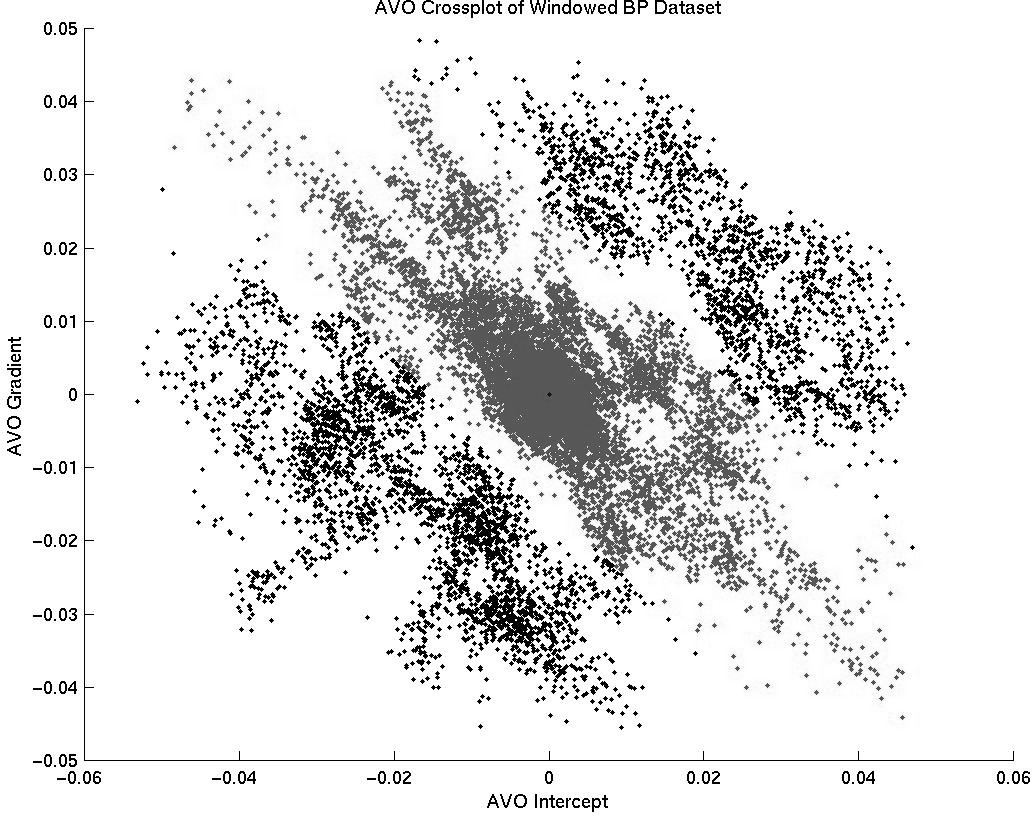
Figure 5 A vs. B scatter-plot with mute fairway defined. |  |
|
plot3
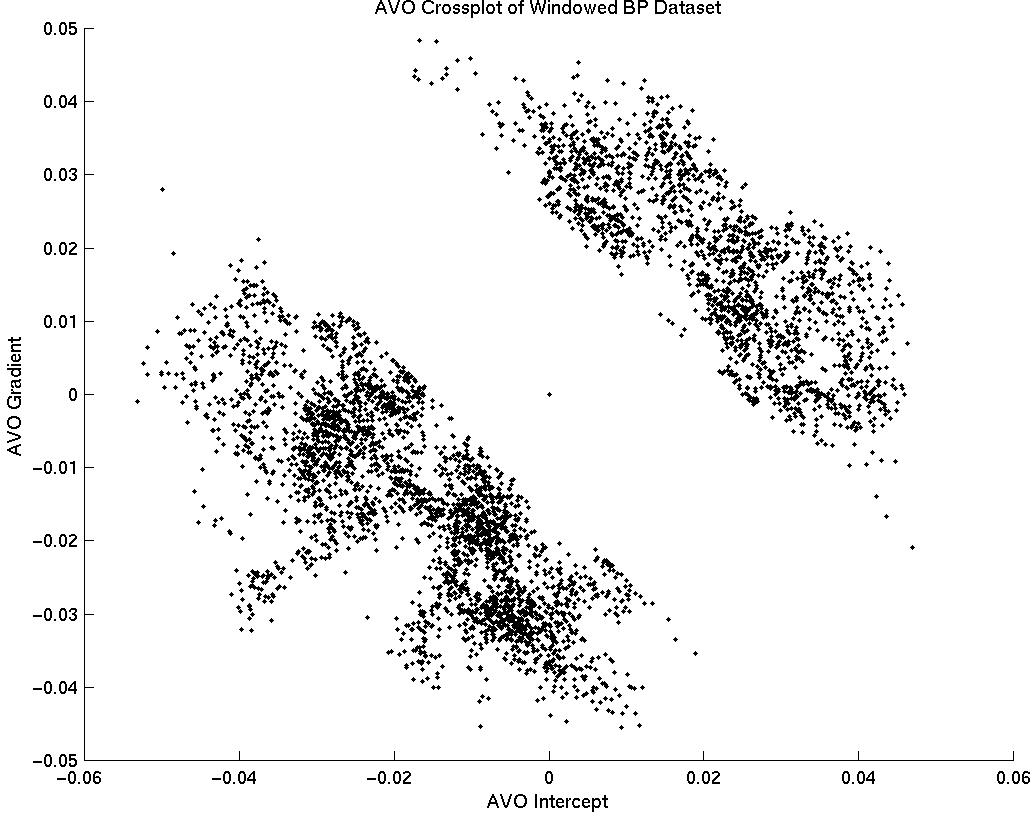
Figure 6 A vs. B scatter-plot with mute fairway zeroed, leaving points of image corresponding to a Class III anomaly. |  |