|
amp
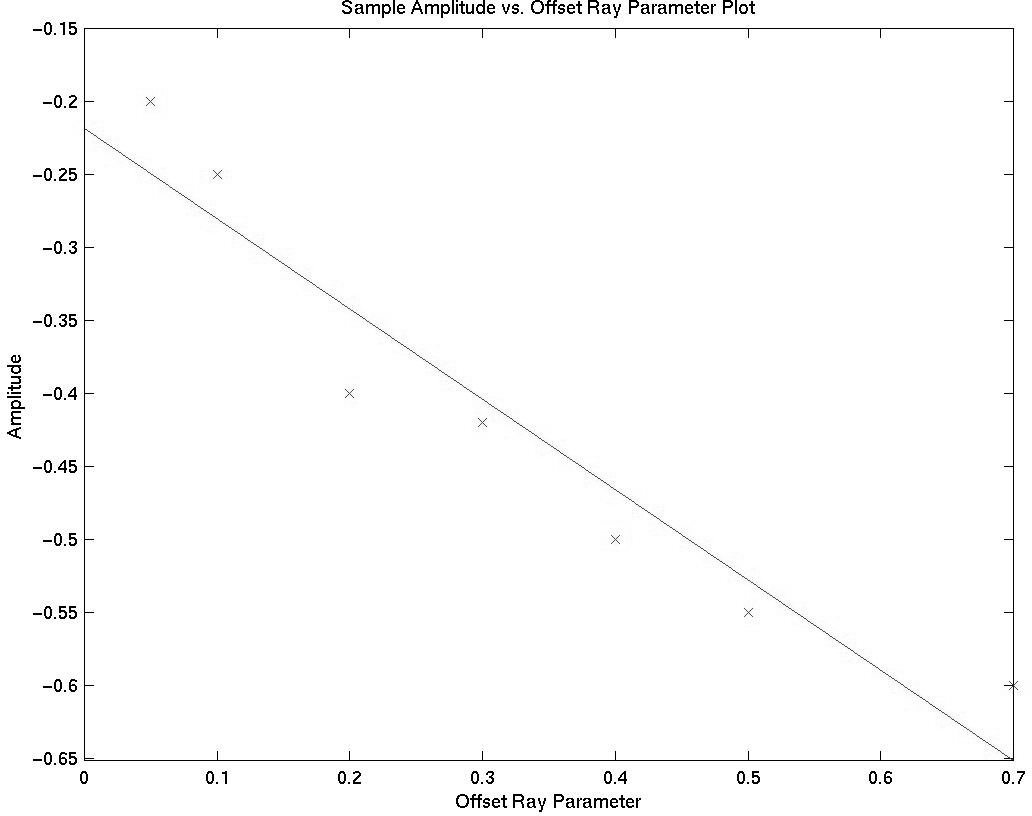
Figure 3 Typical amplitude plot for Class III AVO sand. Line is least-squares fit. Y-intercept of line is A (AVO intercept), slope of line is B (AVO gradient). |  |
The AVA analysis performed in this study is done using AVA cross-plotting Castagna and Swan (1997). There are a number of sources that document this technique as being effective to find Class III AVO sands (low impedance), and a technique described by Ross is the model for our algorithm Ross (2000). The basic outline of this technique involves the plotting of each image point on an A vs. B grid, then zeroing points in the cross-plot, leaving only points of high A*B values.
|
amp
Figure 3 Typical amplitude plot for Class III AVO sand. Line is least-squares fit. Y-intercept of line is A (AVO intercept), slope of line is B (AVO gradient). |  |