 |
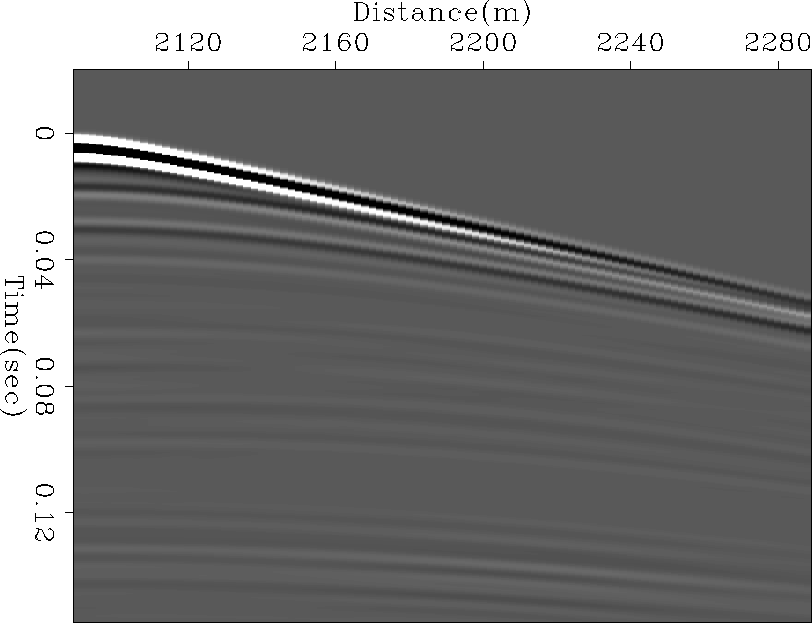
Figure 20 Common Shot Gather from velocity analysis modeling.
The velocity modeling result was used in this part of the paper. The common shot gathers were processed in order to obtain the CMP gather corresponding to the exact well position for the velocity analysis.
The processing consisted of basic steps, first of all a CMP sorting was executed on the common shot gathers. A prediction error filter was calculated on each CMP gather in order to proceed with deconvolution. This basic processing sequence was followed with a bandpass filtering and an AGC Claerbout (1999).
Figures 20 and 21 shows a common shot gather and a common midpoint gather after the sequence processing, respectively, it is possible to note that after the sequence processing applied to the data set the reflection hyperbolas are very well defined, and the common midpoint gather has a behavior of a sequence of layers without structure component or strong lateral velocity variations.
 |
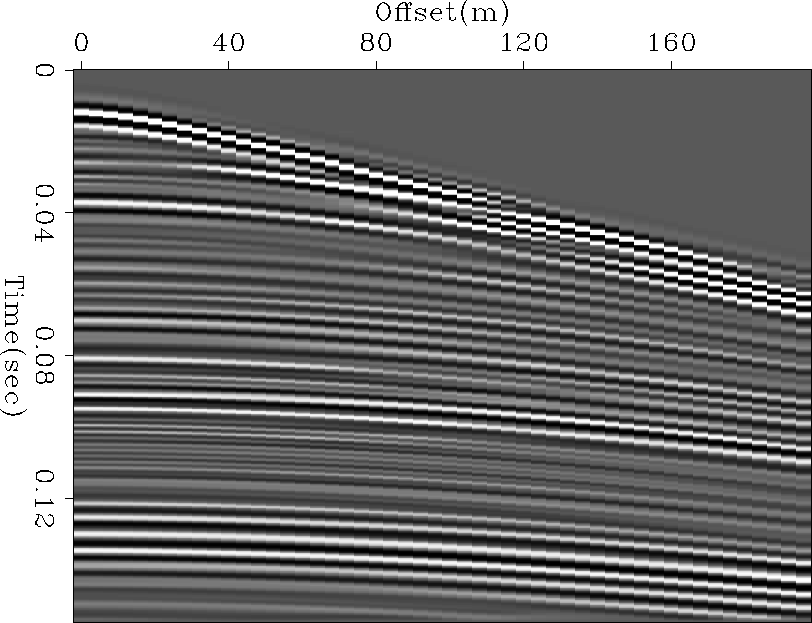 |
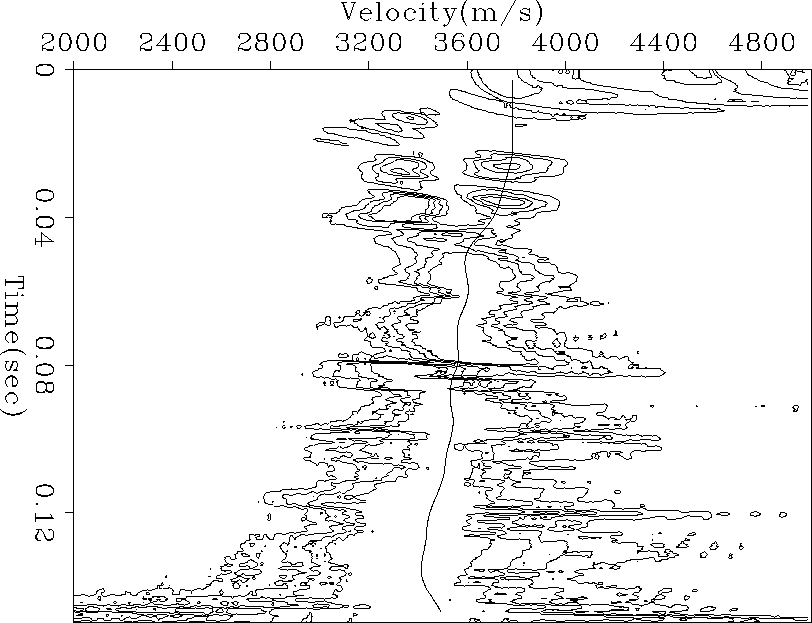
The velocity analysis was performed on the CMP gather showed in Figure 21; the result is showed in Figure 22 with the picking result superimposed. A comparison between the seismic rms velocity and the ``well rms'' velocity, obtained by converting the well velocity into rms velocity in time, is showed in Figure 23. It is possible to note that seismic velocities follow the same tendency as the well velocity. The difference between those velocities are caused by the difference between the seismic experiment and well experiment.
The seismic experiment reads velocities with an horizontal component while the well experiment reads velocities with a vertical component only. This difference produces difference in the values of the velocities that both experiments read.
Another source of differences is the dissimilarity in the frequency content of both experiments.
 |
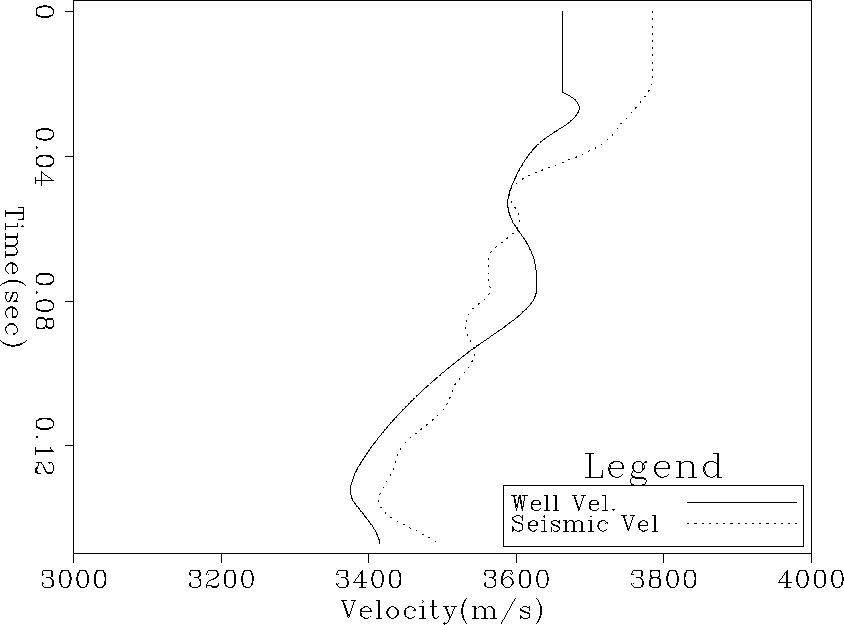 |
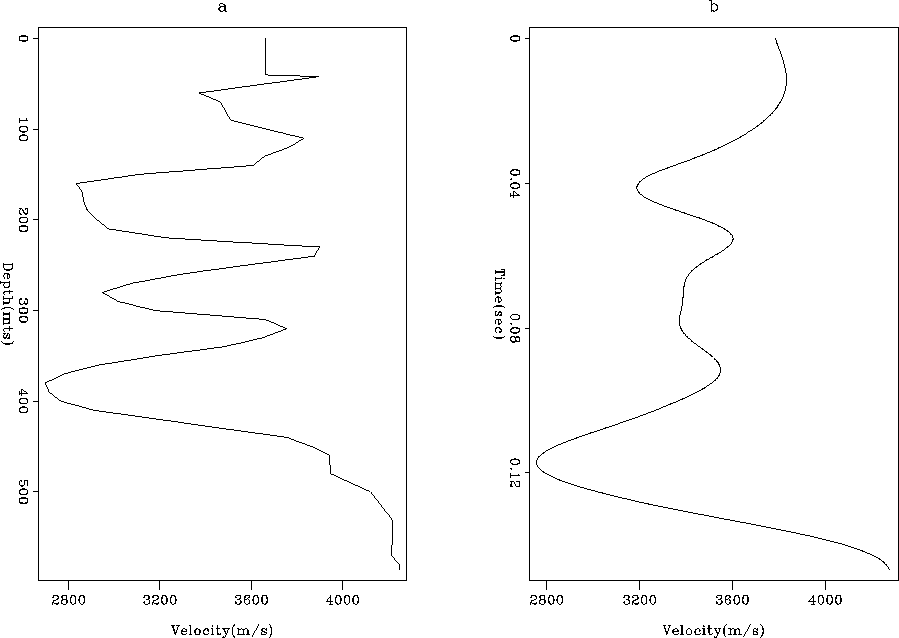
Interval velocity conversion was performed on this actual seismic rms velocity, the methodology discussed in Clapp et al. (1998); Rosales (2000) for interval velocity conversion was used in order to obtain the interval velocity for this CMP. The comparison between the well velocity and the seismic interval velocity is presented in Figure 24.
It is possible to note the frequency difference between both velocities. Seismic velocities have a lower frequency content than well velocities. This difference is mainly originated by the wavelet used for the modeling.
 |