

Next: What next?
Up: Clapp: 3-D tomography field
Previous: Building the steering filters
I applied the fitting goals (4) and obtained a  (Figure
 ![[*]](http://sepwww.stanford.edu/latex2html/cross_ref_motif.gif) ). The change introduced by tomography was a spatially
low frequency increase
in the velocity below the second tomography reflector. The decrease
in slowness
agreed with previous 2-D tomography tests Clapp and Biondi (2000).
After adding in the slowness I ended up with an updated velocity
field (Figure
). The change introduced by tomography was a spatially
low frequency increase
in the velocity below the second tomography reflector. The decrease
in slowness
agreed with previous 2-D tomography tests Clapp and Biondi (2000).
After adding in the slowness I ended up with an updated velocity
field (Figure ![[*]](http://sepwww.stanford.edu/latex2html/cross_ref_motif.gif) ). The new velocity field
is very consistent with the initial model (Figure
). The new velocity field
is very consistent with the initial model (Figure ![[*]](http://sepwww.stanford.edu/latex2html/cross_ref_motif.gif) ).
).
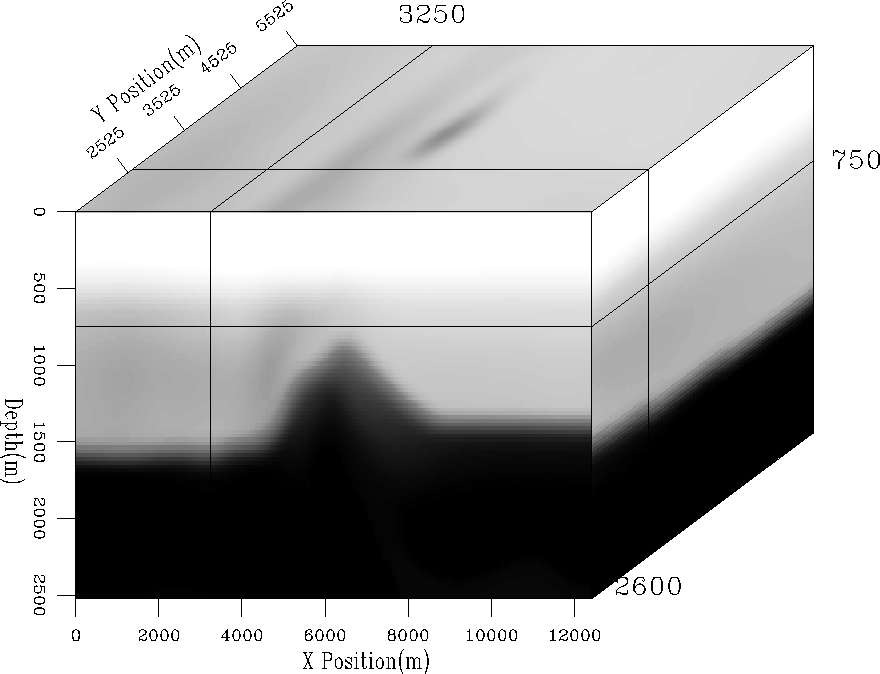
ds-3d
Figure 6 Changes to velocity computed from
first iteration of tomography.


 elf3d.vel1
Figure 7 Velocity after one iteration
of tomography.


Using the updated velocity field I applied
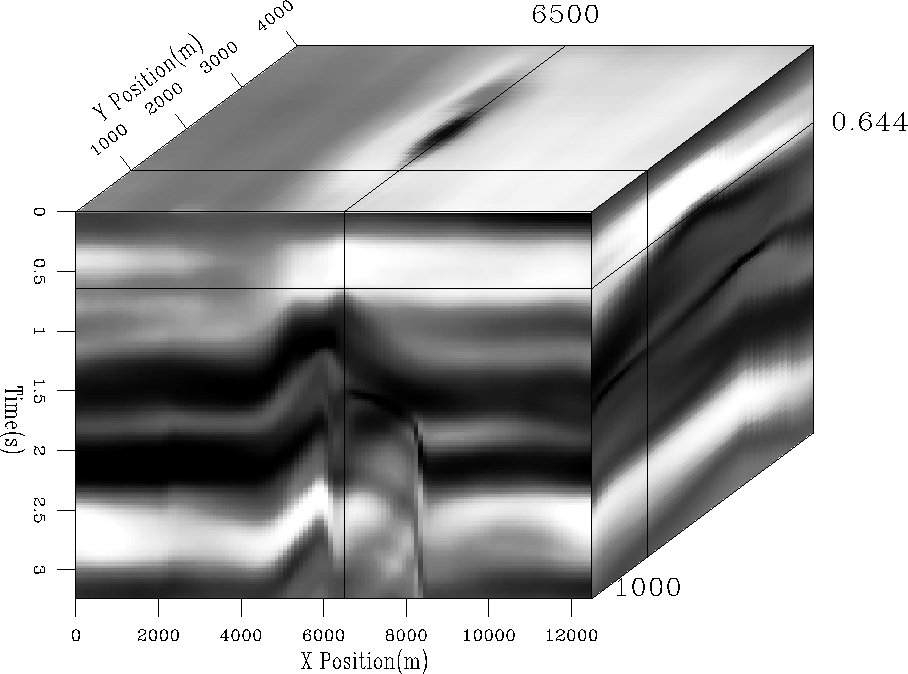
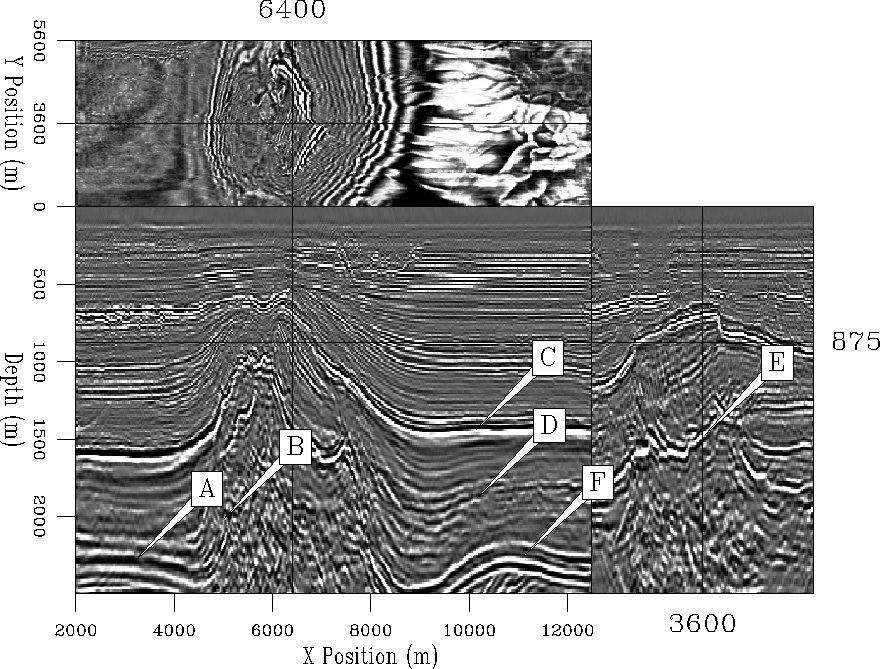
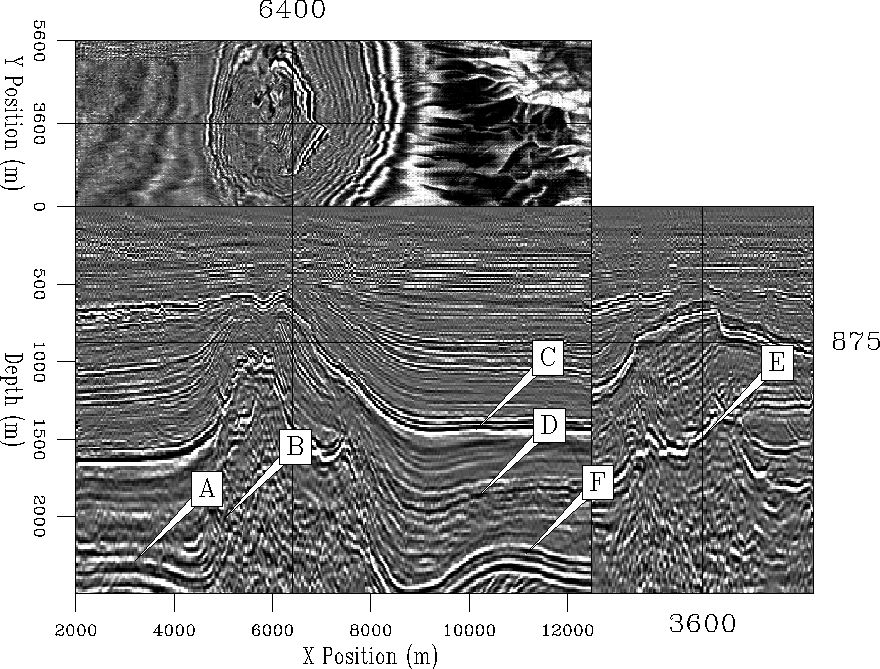
CAM. Figure ![[*]](http://sepwww.stanford.edu/latex2html/cross_ref_motif.gif) shows the migration result. Generally, the image quality is about the same or
slightly improved.
Note that image is worse at `B' (compared
to the initial migration (Figure
shows the migration result. Generally, the image quality is about the same or
slightly improved.
Note that image is worse at `B' (compared
to the initial migration (Figure ![[*]](http://sepwww.stanford.edu/latex2html/cross_ref_motif.gif) ). At
`A' the initial image shows better coherence but the new
migration has a higher frequency content. A sharper image can
also be observed at `C' - `F'.
If we compare common reflection point gathers (Figure
). At
`A' the initial image shows better coherence but the new
migration has a higher frequency content. A sharper image can
also be observed at `C' - `F'.
If we compare common reflection point gathers (Figure ![[*]](http://sepwww.stanford.edu/latex2html/cross_ref_motif.gif) and
and
![[*]](http://sepwww.stanford.edu/latex2html/cross_ref_motif.gif) ) we get a similar story. At
`A', `B', and `E' the gathers are flatter and higher frequency.
At `C' and `D' where the gathers curved up initially they now curve down.
) we get a similar story. At
`A', `B', and `E' the gathers are flatter and higher frequency.
At `C' and `D' where the gathers curved up initially they now curve down.
elf3d.mig0.v2
Figure 8 Migration result using
initial velocity model. Overlaid are several locations where
image quality changes with the new velocity model.


 elf3d.mig1.steer
Figure 9 Migration result after
one iteration of tomography. Note that image is worse at `B' (compared
to the initial migration (Figure ![[*]](http://sepwww.stanford.edu/latex2html/cross_ref_motif.gif) ). At
`A' the initial image show better coherence but the new
migration is higher frequency content. A sharper image can
also be observed at `C' - `F'.
). At
`A' the initial image show better coherence but the new
migration is higher frequency content. A sharper image can
also be observed at `C' - `F'.
![[*]](http://sepwww.stanford.edu/latex2html/movie.gif)


 gather.vel0
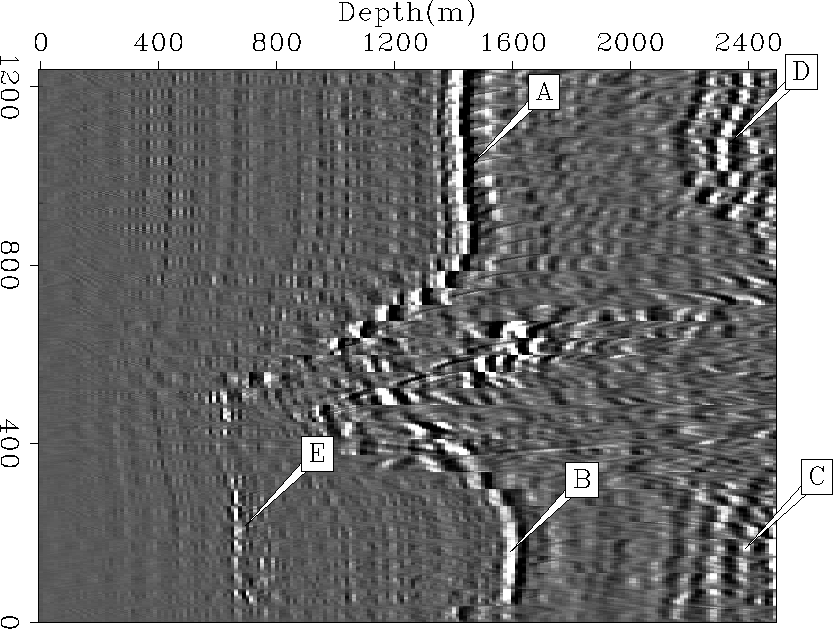
Figure 10 Every 20th CRP from an
inline section of the initial migration.


 gather.vel1.steer
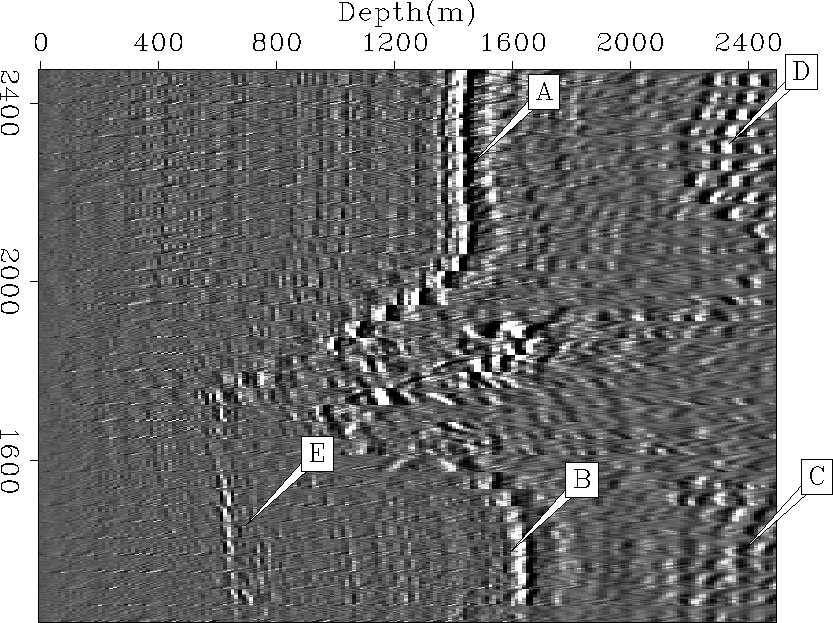
Figure 11 Every 20th CRP
from an inline section of the migration after one iteration
of tomography.
At
`A', `B', and `E' the gathers are flatter and higher frequency than
the gathers in Figure ![[*]](http://sepwww.stanford.edu/latex2html/cross_ref_motif.gif) .
At `C' and `D' where the gathers curved up initially they now curve down.
.
At `C' and `D' where the gathers curved up initially they now curve down.
![[*]](http://sepwww.stanford.edu/latex2html/movie.gif)


Next: What next?
Up: Clapp: 3-D tomography field
Previous: Building the steering filters
Stanford Exploration Project
9/5/2000
![[*]](http://sepwww.stanford.edu/latex2html/cross_ref_motif.gif) ). The change introduced by tomography was a spatially
low frequency increase
in the velocity below the second tomography reflector. The decrease
in slowness
agreed with previous 2-D tomography tests Clapp and Biondi (2000).
After adding in the slowness I ended up with an updated velocity
field (Figure
). The change introduced by tomography was a spatially
low frequency increase
in the velocity below the second tomography reflector. The decrease
in slowness
agreed with previous 2-D tomography tests Clapp and Biondi (2000).
After adding in the slowness I ended up with an updated velocity
field (Figure ![[*]](http://sepwww.stanford.edu/latex2html/cross_ref_motif.gif) ). The new velocity field
is very consistent with the initial model (Figure
). The new velocity field
is very consistent with the initial model (Figure ![[*]](http://sepwww.stanford.edu/latex2html/cross_ref_motif.gif) ).
).
![[*]](http://sepwww.stanford.edu/latex2html/movie.gif)
