

Next: Initial errors
Up: Clapp: 3-D tomography field
Previous: Extension to 3-D
The data were acquired over a
salt dome using three cables of 3570m length with geophones every 25m.
The CMP sampling inline was 13.33m and crossline of 25m.
The entire survey covered 13.5km inline and 4km crossline.
Although this
is not an exceptionally large 3-D survey,
tomography is an iterative process so reducing the cost of the migration
is an important consideration. For tomography, well
implemented Kirchhoff methods which
can produce a sparse set of CRP gathers are ideal. An alternate approach
when dealing with marine data
is Common
Azimuth Migration (CAM) Biondi and Palacharla (1996). CAM
requires more expensive full volume imaging, but provided three advantages
to me:
This dataset has been previously migrated using CAM
Vaillant and Calandra (2000); Vaillant and Sava (1999) at SEP.
In this paper, and the previous papers,
the data volume was reduced to 10.5km inline and
4km crossline.
CAM operates in the frequency-wavenumber domain so the data had
to be placed on a regular grid.
Data regularization was performed using Azimuth Moveout (AMO) Biondi et al. (1998).
In the process of performing AMO the dataset was resampled.
The resampled dataset had CMP spacing of 20m in the inline and 25m
in the crossline. The offset range was resampled to 50m ranging
from 200m to 3400m.
This paper is simply attempt to prove that the concept works in 3-D,
so for computational speed I decided to concentrate on the
first 2500m in depth. Therefore
I began by using only the first 3 seconds of the data. By windowing
the data I was able to reduce the number of frequencies needed from 176 to
108 while still being able to handle frequencies up to 54Hz.
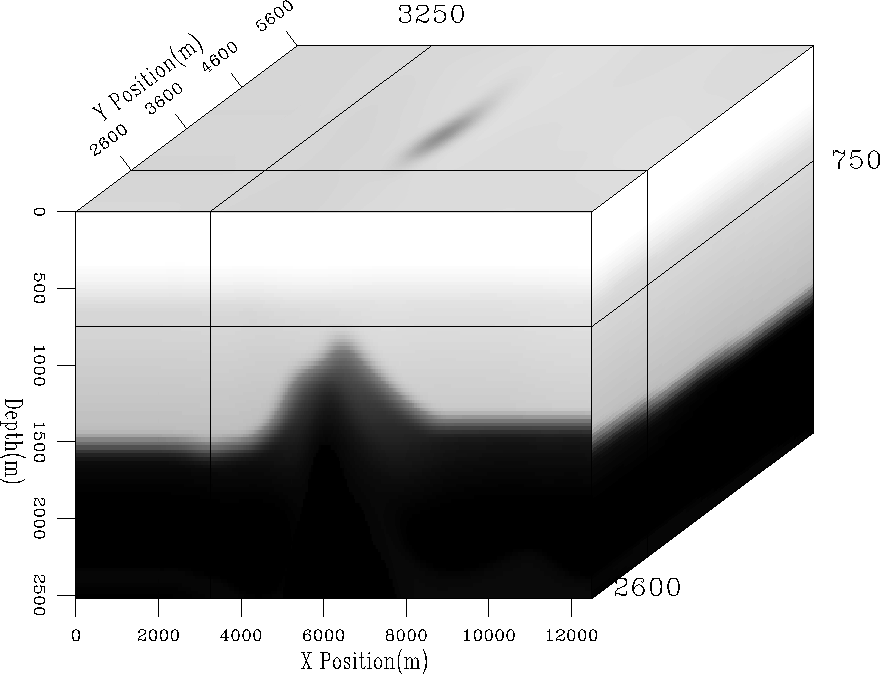
The initial velocity model was created using the
S.M.A.R.T![[*]](http://sepwww.stanford.edu/latex2html/foot_motif.gif) method Ehinger and Lailly (1995); Jacobs et al. (1992).
Early migration tests
showed that a better migration result could be obtained by
smoothing the model Vaillant and Sava (1999) .
As a result the S.M.A.R.T. model was smoothed,
preserving the sharp salt boundary (Figure
method Ehinger and Lailly (1995); Jacobs et al. (1992).
Early migration tests
showed that a better migration result could be obtained by
smoothing the model Vaillant and Sava (1999) .
As a result the S.M.A.R.T. model was smoothed,
preserving the sharp salt boundary (Figure ![[*]](http://sepwww.stanford.edu/latex2html/cross_ref_motif.gif) ).
Using the velocity in Figure
).
Using the velocity in Figure ![[*]](http://sepwww.stanford.edu/latex2html/cross_ref_motif.gif) the data was migrated
with six reference velocities and frequency range of 5 to 60 Hz
Vaillant and Calandra (2000).
Figure
the data was migrated
with six reference velocities and frequency range of 5 to 60 Hz
Vaillant and Calandra (2000).
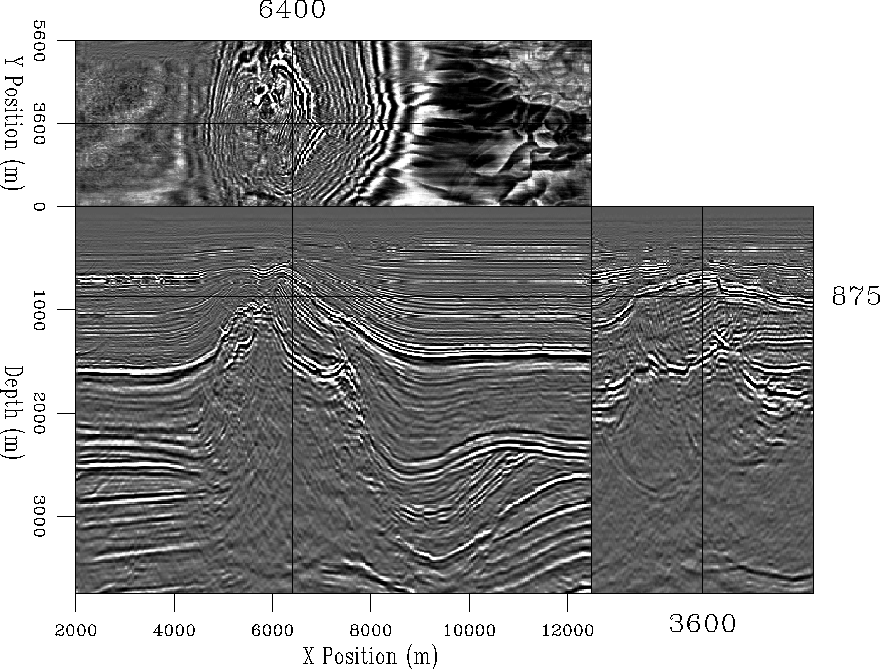
Figure ![[*]](http://sepwww.stanford.edu/latex2html/cross_ref_motif.gif) shows the initial migration result.
Note how the reflectors generally have good coherency but die out
at the top of the salt and along the salt flanks.
shows the initial migration result.
Note how the reflectors generally have good coherency but die out
at the top of the salt and along the salt flanks.
elf3d.vel0
Figure 1 Initial ELF velocity model.


 elf3d.mig.vel0
Figure 2 Initial migration using
the velocity in Figure ![[*]](http://sepwww.stanford.edu/latex2html/cross_ref_motif.gif) .
.


Next: Initial errors
Up: Clapp: 3-D tomography field
Previous: Extension to 3-D
Stanford Exploration Project
9/5/2000
![[*]](http://sepwww.stanford.edu/latex2html/foot_motif.gif) method Ehinger and Lailly (1995); Jacobs et al. (1992).
Early migration tests
showed that a better migration result could be obtained by
smoothing the model Vaillant and Sava (1999) .
As a result the S.M.A.R.T. model was smoothed,
preserving the sharp salt boundary (Figure
method Ehinger and Lailly (1995); Jacobs et al. (1992).
Early migration tests
showed that a better migration result could be obtained by
smoothing the model Vaillant and Sava (1999) .
As a result the S.M.A.R.T. model was smoothed,
preserving the sharp salt boundary (Figure ![[*]](http://sepwww.stanford.edu/latex2html/cross_ref_motif.gif) ).
Using the velocity in Figure
).
Using the velocity in Figure ![[*]](http://sepwww.stanford.edu/latex2html/cross_ref_motif.gif) the data was migrated
with six reference velocities and frequency range of 5 to 60 Hz
Vaillant and Calandra (2000).
Figure
the data was migrated
with six reference velocities and frequency range of 5 to 60 Hz
Vaillant and Calandra (2000).
Figure ![[*]](http://sepwww.stanford.edu/latex2html/cross_ref_motif.gif) shows the initial migration result.
Note how the reflectors generally have good coherency but die out
at the top of the salt and along the salt flanks.
shows the initial migration result.
Note how the reflectors generally have good coherency but die out
at the top of the salt and along the salt flanks.

