next up previous print clean
Next: Discussion/Conclusions Up: Brown et al.: Signal/Noise Previous: Methodology

Results

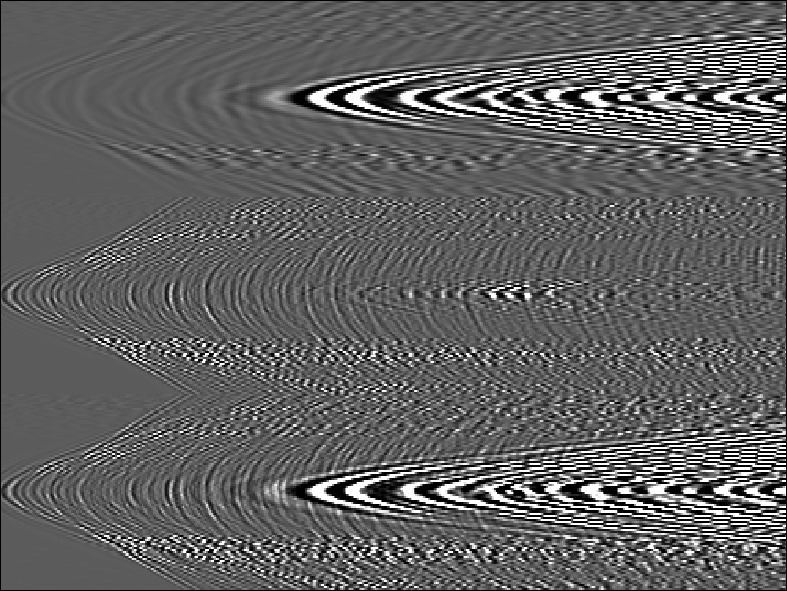
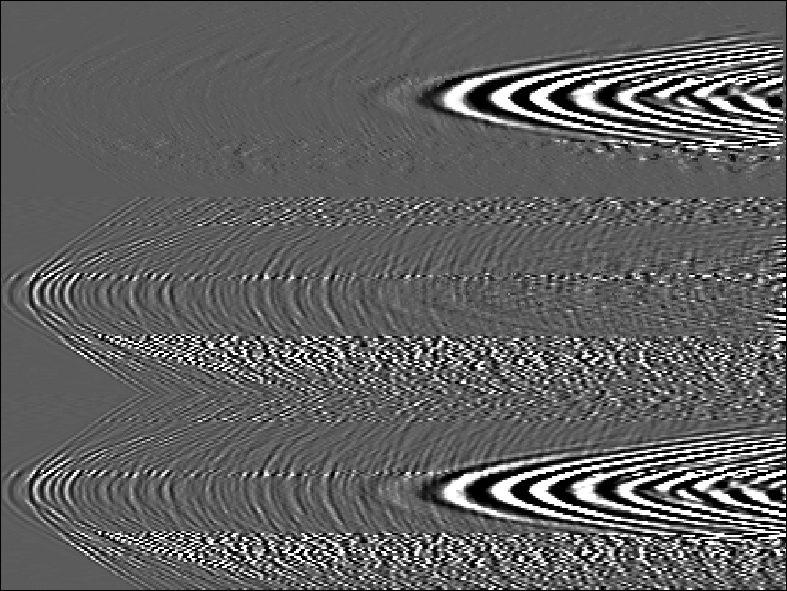
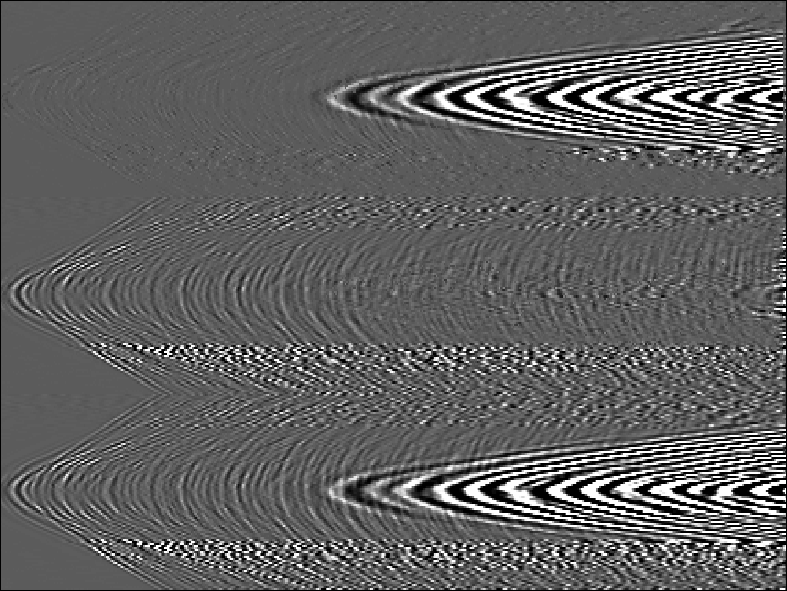
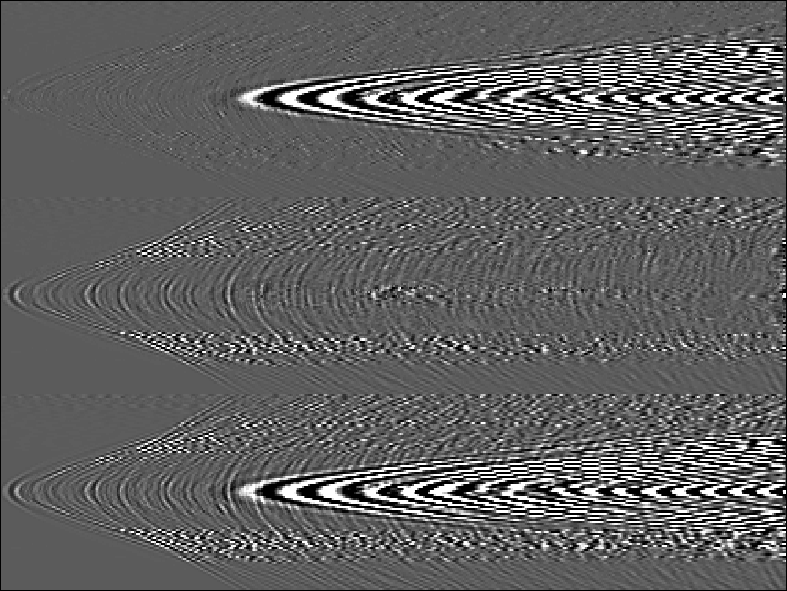
We applied the technique to four 2-D receiver lines from a Middle East 3-D shot gather. One of these 2-D lines was shown earlier in Figure 2. The results are shown in Figures 3, 5, 6, and 7. Considering the low S/N, the extraction result is quite impressive. Many primary events which were hopelessly masked in the raw data become apparent after signal/noise separation. As proof of the power of this method of separation, compare Figure 3 to Figure 4, where the latter is simply the result of subtracting the noise model from the data, or equivalently, lowcut filtering. The lowcut filter very effectively suppresses the ground roll, but severely damages the low frequency portion of the signal. The difference between the two results reinforces the fact that the predictive method can and will succeed with an imperfect noise model. Although the predictive method places some signal energy in the noise panel, the character of the signal seems preserved for the most part. Likely, any degradation of the signal within the noise cone is embedded signal which was not ignored in the estimation of $\bf N$.

 
dune-pred-daterr
dune-pred-daterr
Figure 3
Receiver line #1 - predictive method results. From left to right: 1) Input data. 2) Predicted signal. 3) Difference, i.e., predicted noise.


view burn build edit restore

 
dune-locut-daterr
dune-locut-daterr
Figure 4
Receiver line #1 - highpass filter results. From left to right: 1) Input data. 2) Highpass (20 Hz cutoff) filter applied to data 3) Difference, i.e., noise model.


view burn build edit restore

 
dune1-pred-daterr
dune1-pred-daterr
Figure 5
Receiver line #2 - predictive method results. From left to right: 1) Input data. 2) Predicted signal. 3) Difference, i.e., predicted noise.


view burn build edit restore

 
dune2-pred-daterr
dune2-pred-daterr
Figure 6
Receiver line #3 - predictive method results. From left to right: 1) Input data. 2) Predicted signal. 3) Difference, i.e., predicted noise.


view burn build edit restore

 
dune3-pred-daterr
dune3-pred-daterr
Figure 7
Receiver line #4 - predictive method results. From left to right: 1) Input data. 2) Predicted signal. 3) Difference, i.e., predicted noise.


view burn build edit restore


next up previous print clean
Next: Discussion/Conclusions Up: Brown et al.: Signal/Noise Previous: Methodology
Stanford Exploration Project
10/25/1999