 |
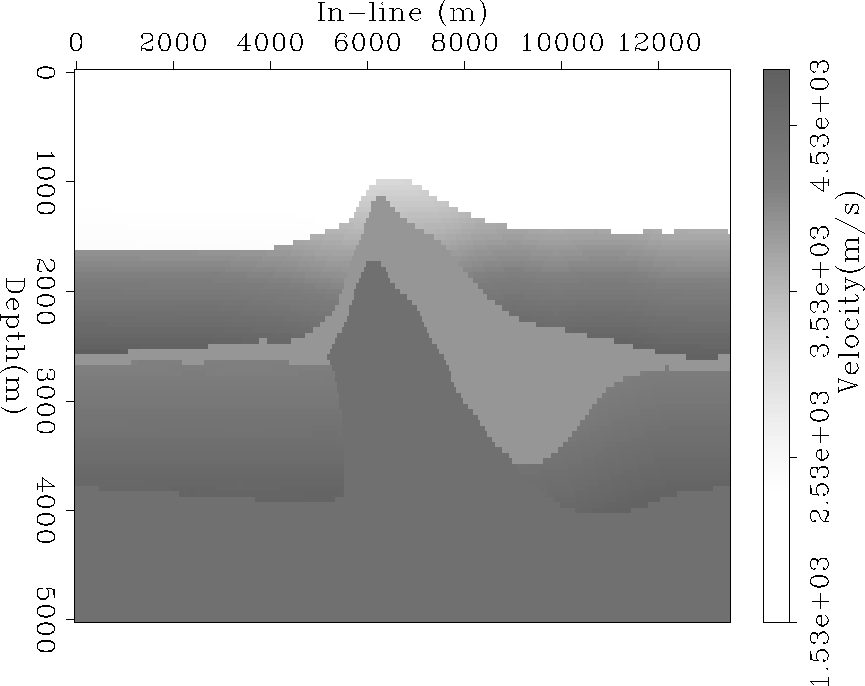
Figure 5 Depth velocity model of the survey area.
This section presents the results of applying AMO for partial stacking of a 3D marine data set. The data is courtesy of Elf Aquitaine and represents a 3D survey over a large salt body in the North Sea. Proper imaging of the data requires 3D prestack depth migration. Given the size of the survey (13.5 km x 10.5 km), the cost of depth imaging is considerably high. The goal is to reduce the size of the data by partial stacking before migration since the cost of migration is roughly proportional to the size of input data. The resulting partial stacks can then be migrated separately, and either stacked together to form the final image or individually analyzed for amplitude and velocity variations.
Conventional processing applies NMO before partial stacking in order to increase the coherency across the input traces and reduce noise by destructive interference. However, such trace-to-trace transformation is insufficient in the presence of dipping energy and acts as a dip filter for diffractions and dipping beds. Therefore we need to apply AMO before stacking in order to insure the preservation of all the dips in the data.
 |
 |
Figure vel-model shows the depth velocity model for the area. The geology is fairly continuous along the cross-line axis and varies rapidly in the in-line direction as shown in Figure vel-section which displays the respective velocities of the layers. Figure stack shows an NMO-Stack of the middle offsets (between 1,000 and 2,000 m). The edges of the salt dome create a lot of diffractions visible in the middle of the section between 2.0 and 3.5 s. They are the areas where AMO is expected to make most of the difference. The bright reflections at around 1.6 s are generated at the salt-sediments interface. The fairly steep reflections at the right edge of the section between 2.0 and 2.5 s are caused by the flanks of the salt swells. These dipping reflections also require AMO before stacking in order to preserve their high-frequency components.
Mid-stackwidth=5.5in,height=7.0inCR NMO-Stack of North Sea data set used for testing AMO.
The data were acquired using source spacing of 50 meters and receiver spacing of 25 meters for an offset range from 190 m to 3340m. The nominal common-midpoint spacing is 13.33 m in the in-line direction and 25 m in the cross-line direction. To make the data handling and processing quicker, I processed only a subset of the whole data set. I selected a window of 600 time samples that included all major reflections and salt diffractions between 0.6 and 3.0 seconds. I also extracted the central 750 midpoints in the in-line direction, for a total length of 10.0 km, and 120 midpoints in the cross-line, for a total width of 3.0 km. The traces had an offset range from 1000 to 1400 meters and included all recorded azimuths. Figure off-azim shows the offset-azimuth distribution for the extracted 3D subset.
off-azimheight=3.2inCR Offset-azimuth distribution of the 1,000-1,400 m offset range.
To test the effects of AMO on the prestack data, I applied two distinct partial stacking methods to the data: NMO followed by partial stacking (NMO-stacking) and NMO followed by AMO and partial stacking (NMO-AMO-stacking). To make the comparison as fair as possible to the conventional methodology of simple NMO-stacking, the traces after NMO were laterally interpolated in the midpoint direction before they were stacked into the output cube. Tests showed that this lateral interpolation preserved the dipping events significantly better than a simple binning procedure. The output model is a regularly sampled cube of 750 by 120 midpoints, with nominal offset of 1,200 meters and effective azimuth of zero degrees. The number of input traces was about 650,000. Therefore, the data-reduction rate achieved by partial stacking is approximately 7.4.
During the preprocessing stage by ELF, a hyperbolic mute with a sharp cut-off was applied to the data to remove the first arrival and the aliased noise at the far offsets. ELF also provided the depth velocity model which needed to be converted to time rms-velocities for NMO processing.
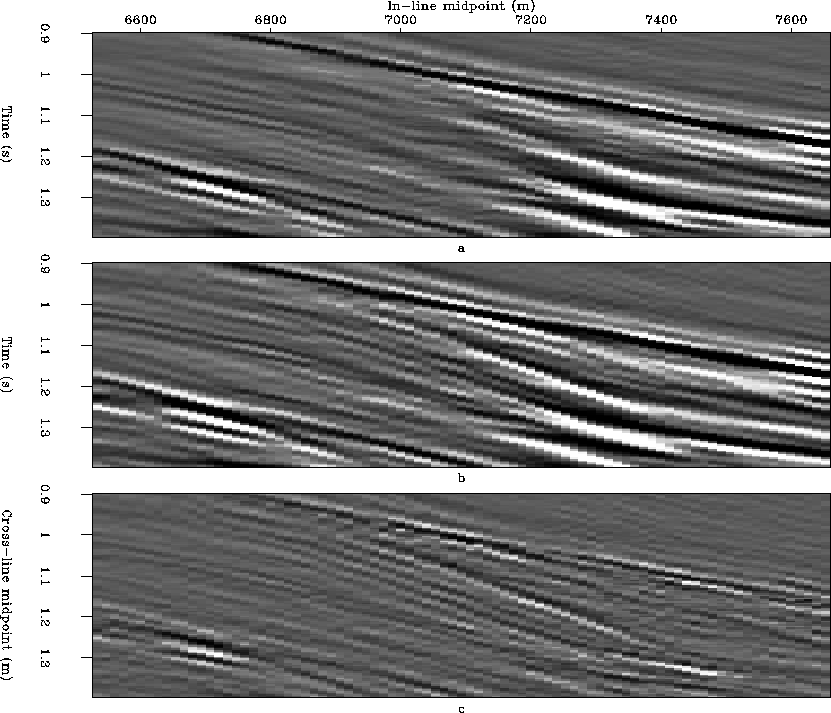
Figure inline compares the results obtained with the two flows described above for the 1,000-1,400 m offset range. The figure displays a window of an in-line section, located at 4,150 m along the cross-line axis and centered on the salt body where the data show numerous high-frequency diffractions. Figure inlinea shows the section obtained by simple NMO-stacking, while Figure inlineb shows the results of NMO-AMO-stacking. As expected, the addition of AMO to the partial stacking process preserves the diffractions better than simple NMO. Figure inlinec shows the differences between the two sections; diffractions and other dipping energy are clearly evident.
 |
 |
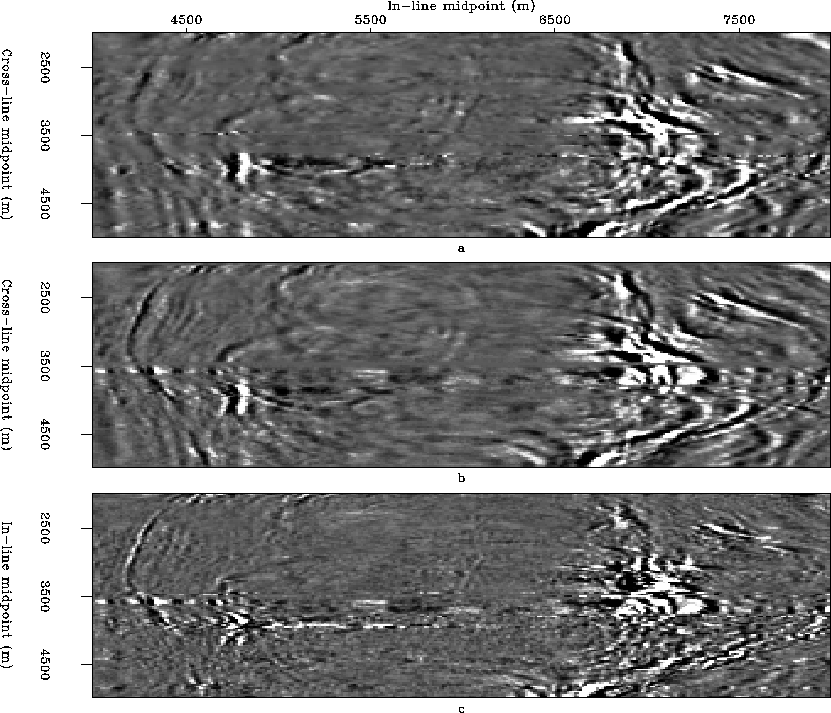
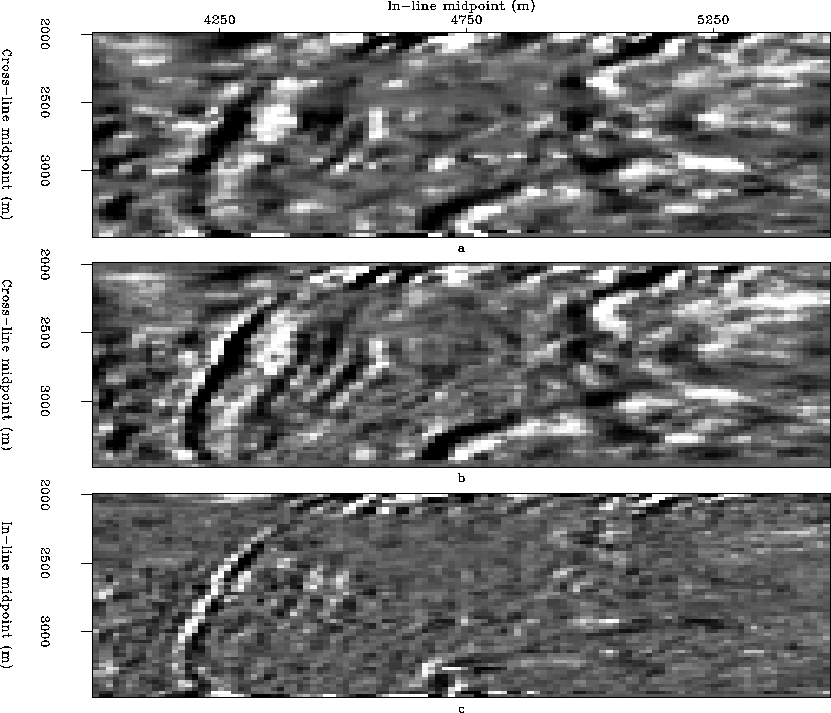
Figure slice compares the time slices at 1.36 s, obtained by NMO-stacking (Figure slicea), and NMO-AMO-stacking (Figure sliceb). The difference section (Figure slicec) clearly shows that few trends of high-frequency diffractions were not correctly preserved by the conventional process. Some acquisition footprint is also present in the difference section and shows the role of AMO in regularizing the geometry of the subset. Although there are not many gaps in the data, the AMO process interpolated the few missing lines in the survey. For better illustration of the results, Figures inline2 and slice1 show the same comparisons on smaller windows from the inline and time-slice sections.
 |
 |