

Next: More than two sources
Up: INTERPOLATING MISSING TRACES
Previous: Radial Smoothing
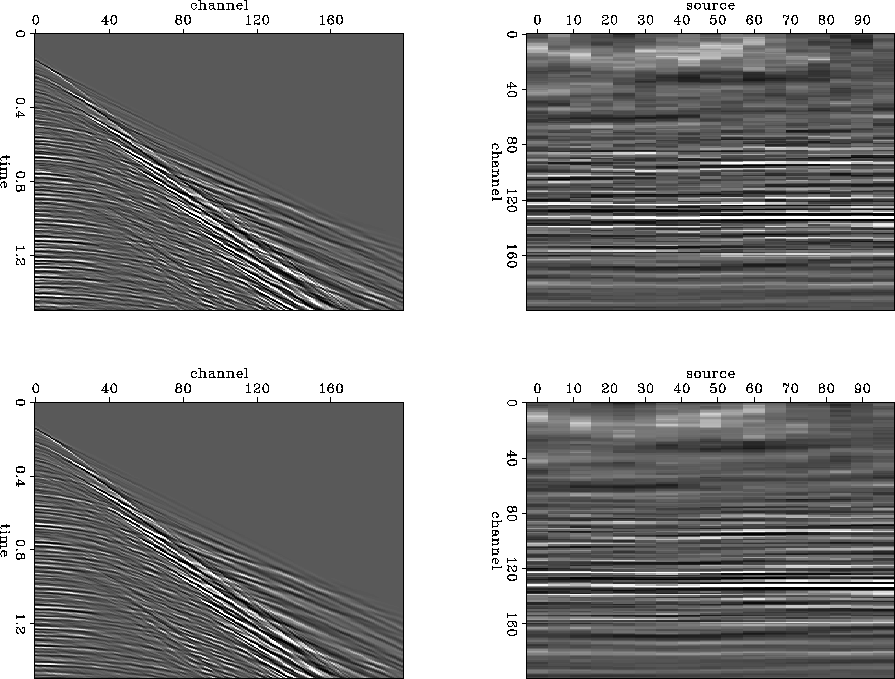
Some data from a 3-D marine survey are shown in Figure curtFig1.
The top left panel shows part of a shot gather, and the top right panel shows
a time slice through
several shots from the same source and the same streamer.
Marine 3-D data may be broken up into a set of 2-D surveys or treated
as a single 3-D survey; more on that later.
In this particular case, the data are fairly routine, but they
can serve to illustrate the method.
The bottom half shows the output of removing half the
shots and then interpolating them.
curtFig1
Figure 2 Example input data. The top left panel is part of a
shot gather from a 3-D survey, the top right panel is a time slice through
several shots from the same source into the same streamer.
Bottom panels are the same, after zeroing every other gather and
interpolating.


Next: More than two sources
Up: INTERPOLATING MISSING TRACES
Previous: Radial Smoothing
Stanford Exploration Project
4/20/1999
