

Next: Conclusions
Up: Biondi: Subsalt imaging by
Previous: SEG/EAGE Salt data set
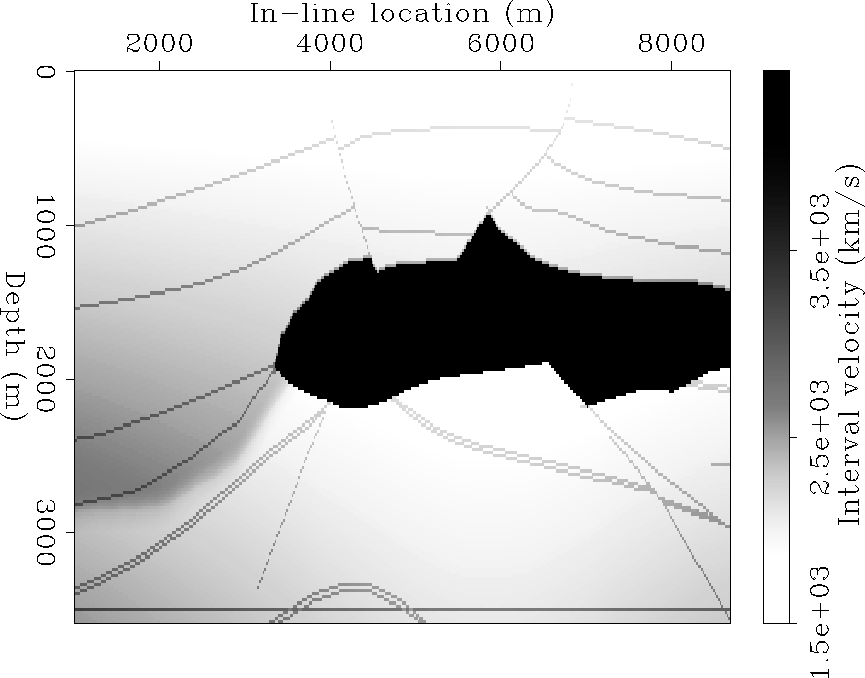
Figure 2
shows a typical in-line section through the velocity model,
taken at the constant cross-line coordinate y=6,850 m.
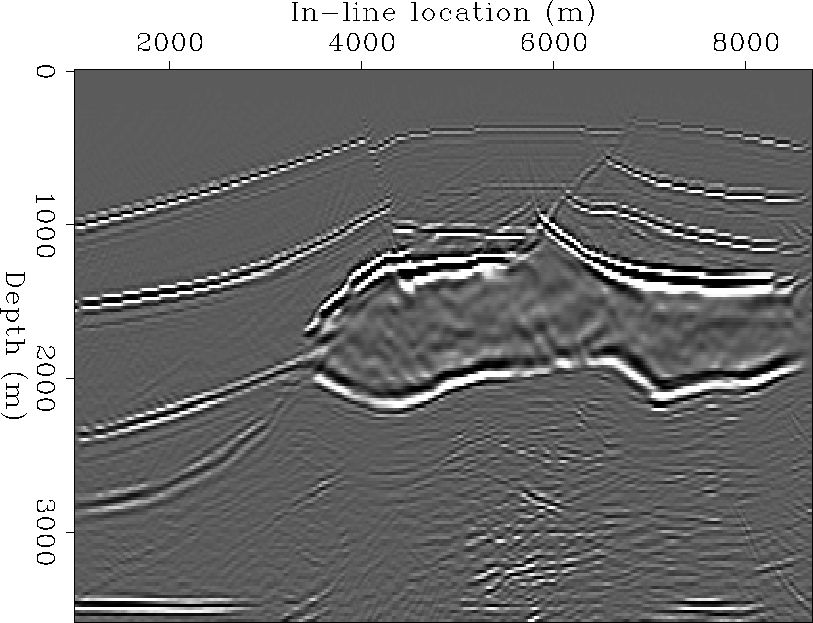
Figure 3 shows the corresponding
common-azimuth migration results.
Almost perfect images are obtained for
the reflectors in the sediment above the salt,
the top and the bottom of the salt.
The flat `basement' is well imaged in some areas and not in others.
The dipping reflectors in the subsalt are not easily distinguishable
from the background noise, if they are present at all.
The good results above the salt are to be expected from
common-azimuth migration.
Prestack time migration would have produced similarly good
results.
However, poststack migration after constant velocity
DMO would have had trouble to image correctly the steep
faults that terminate at the top of the salt because
of NMO-velocity conflicts
Biondi (1998a); Rietveld et al. (1997).
Vel-salt-y6850
Figure 2
Velocity model at constant cross-line coordinate y=6,850 m.


Wave-salt-whole-y6850
Figure 3
Common-azimuth migration at constant cross-line coordinate y=6,850 m.


The focus of this paper is on the subsalt region,
and on the comparison with Kirchhoff migration results.
Figure 4
shows the in-line section taken through the velocity cube
at constant cross-line coordinate y=9,820 m .
This section is interesting because it crosses both sand lenses
in the subsalt.
Further, between the lenses there is
an anticlinal structure broken by converging normal faults
that has some chances to be visible in the images because
it is flattish.
Figure 5 shows the subsalt
images obtained by Kirchoff migration (top)
and common-azimuth migration (bottom).
The common-azimuth image is superior to the Kirchhoff image
in several ways.
First, the common-azimuth image lacks the strong coherent
artifacts that makes the Kirchhoff image difficult to interpret.
These artifacts are caused by partially
coherent stacking of multipathing events along wrong trajectories.
They are typical of Kirchhoff subsalt images,
and can be only partially removed
by a ``smart'' selection of the Kirchhoff summation surfaces,
such as the ones suggested by the most-energetic arrival
or shortest-path
criteria Nichols et al. (1998).
Second, both lenses are interpretable from the common-azimuth
image while in the Kirchhoff image they are either
lost in the noise (top lens)
or completely missing (bottom lens).
Third, both the bottom of the salt and the basement
are more continuous in the common-azimuth image.
On the other hand,
the large fault visible on the left part of
the section at (1,800-4,000 m) is not perfectly
imaged by common-azimuth migration.
I will analyze this problem in more detail
at the end of this section
with the help of cross-line sections
(Figure 9,
Figure 10 and
Figure 11).
Vel-salt-y9820
Figure 4
Velocity model at constant cross-line coordinate y=9,820 m.


Both-salt-under-y9820
Figure 5
Kirchhoff migration (a) and common-azimuth migration (b)
at constant cross-line coordinate y=9,820 m.
Both sections are rendered using the same (98) percentile for
clipping amplitudes.


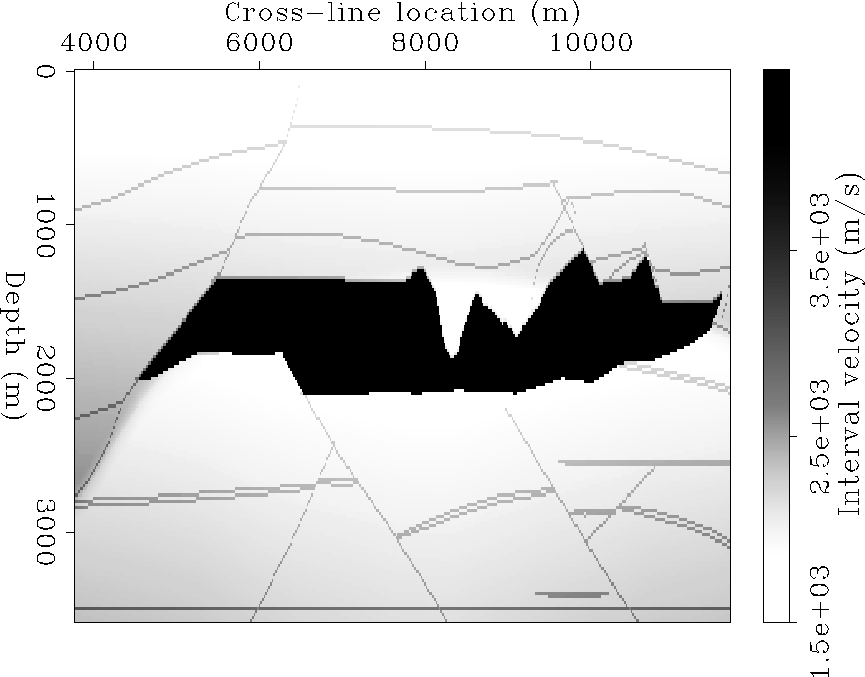
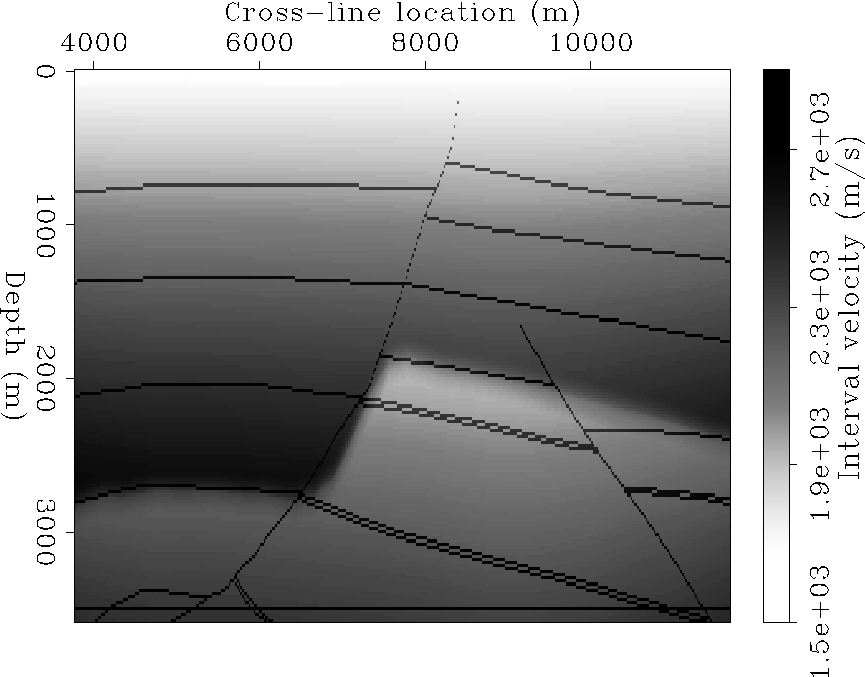
Figure 6
shows the cross-line section taken through the velocity cube
at constant in-line coordinate y=7,440 m.
This cross-line section passes through the two subsalt lenses
as the in-line section shown in Figure 4.
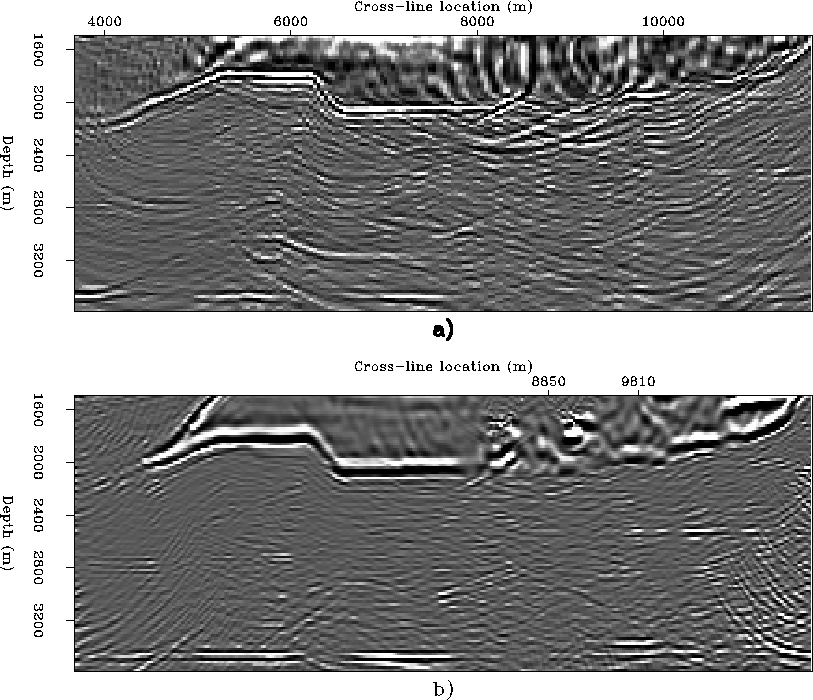
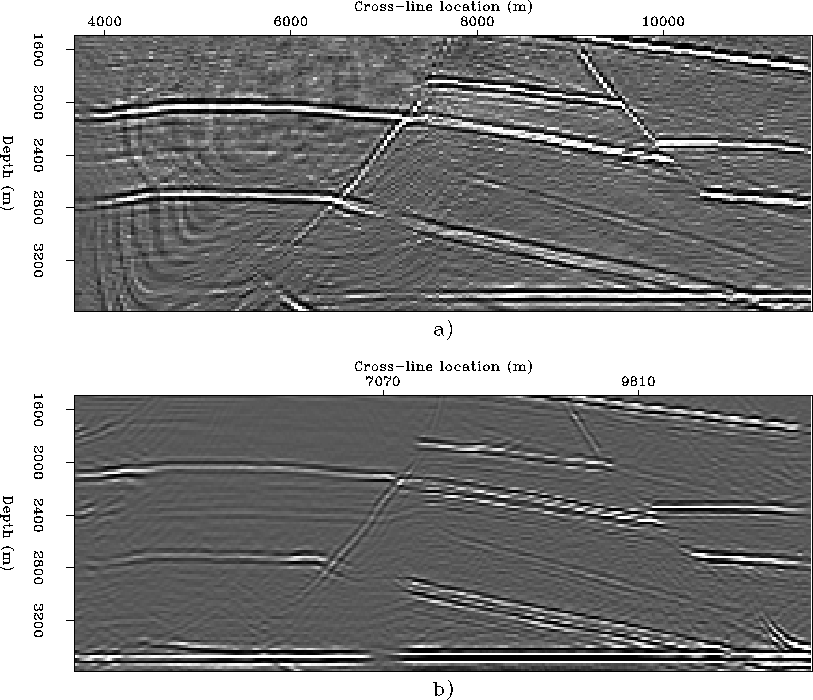
Figure 7
shows the corresponding migrated images;
Kirchhoff migration on the top and common-azimuth migration
on the bottom.
As before, the two lenses are clearly interpretable
in the common-azimuth image, whereas they are not
in the Kirchhoff image.
However, in this case the central portion of the
salt bottom is not perfectly imaged in either of the two images.
This area is right below the deep canyons in the salt body
visible in Figure 6.
The steep flanks of the canyons,
and the large velocity
contrast between the salt body and the soft sediments
filling the canyons,
cause a severe distortion of the reflected wavefield.
The bottom of the salt and the reflectors below,
including the basement, are thus poorly illuminated.
In the column below the canyons,
the Kirchhoff image shows strong artifacts
that could be easily interpreted as reflections.
The common-azimuth image is much cleaner,
although without interpretable coherent events.
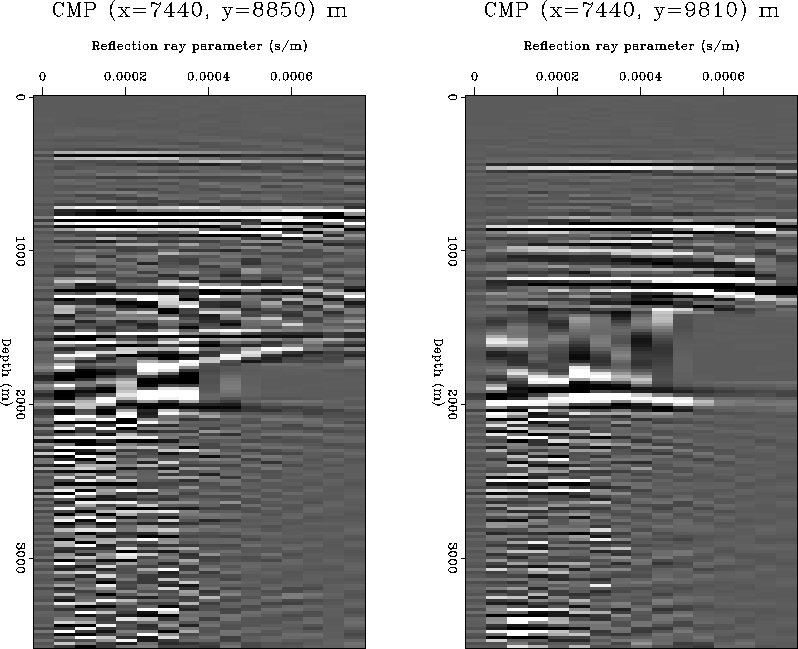
The poor reflectors' illumination
below the canyons can be analyzed further by looking
at the Common Image Gathers (CIG) displayed in
Figure 8.
The gather on the left corresponds to a cross-line location
right below the canyons;
the one on the right is further toward the right.
In both gathers, the images of the reflectors above
the salt and the top-of-salt
are well imaged and are
aligned nicely along the offset ray parameter axis.
In the gather on the right,
the bottom of the salt,
the shallower lens, the deeper lens, and the basement
are also coherent and well aligned horizontally.
But in the gather on the left,
there is very little coherent energy below the salt.
Vel-salt-x7440
Figure 6
Velocity model at constant in-line coordinate x=7,440 m.


Both-salt-under-x7440
Figure 7
Kirchhoff migration (a) and common-azimuth migration (b)
at constant in-line coordinate x=7,440 m.
Both sections are rendered using the same (98) percentile for
clipping amplitudes.


AVO-salt-8850-9810-x7440
Figure 8
Angle-domain Common Image Gathers obtained by common-azimuth
migration.
The locations of these CIGs are marked
on the in-line axis of the common-azimuth image shown in
Figure 7


Finally, I analyze the question of the poor imaging
by common-azimuth migration of the fault shown in
Figure 5.
Figure 9 and
Figure 10
show respectively the velocity model and the migrated
images at constant in-line coordinate x=2,560 m.
The fault under study is the fault on the right part
of the sections.
The deeper part of the fault is not illuminated
by the data because of lack of spatial coverage,
and thus is not imaged by either Kirchhoff migration
or common-azimuth migration.
The shallower part of the fault is well imaged
by both migrations,
but the middle part of the fault
is well imaged by Kirchhoff migration and not
by common-azimuth migration.
The poor imaging seems to be correlated
with the velocity inversion right above the fault
visible in the velocity sections
(Figure 4 and Figure 9).
Both the geological dip and
the local gradient of the velocity function
are roughly oriented at an angle of 45 degrees
with respect to the shooting direction.
Therefore, they have a large component in the cross-line direction,
creating the conditions under which the approximations
inherent in common-azimuth migration are the worst
Biondi and Palacharla (1996).
On the other hand, the problem may be simply caused
by the fact that I used too few reference velocities (three)
when I downward continued the wavefield with
an extended split-step method.
This issue deserves more studies and
to investigate it further.
I am now developing a better common-azimuth
continuation method based on
Ristow's Fourier finite-difference methodology
Ristow and Ruhl (1994).
Both Kirchhoff migration and common-azimuth migration
have trouble to image the two deeper flattish reflectors
at cross-line location of about 7,000 meters.
The culprit seems to be again the sharp velocity contrast
above the fault.
However, the problem may be caused by the salt edge
above the reflectors, not visible in these sections.
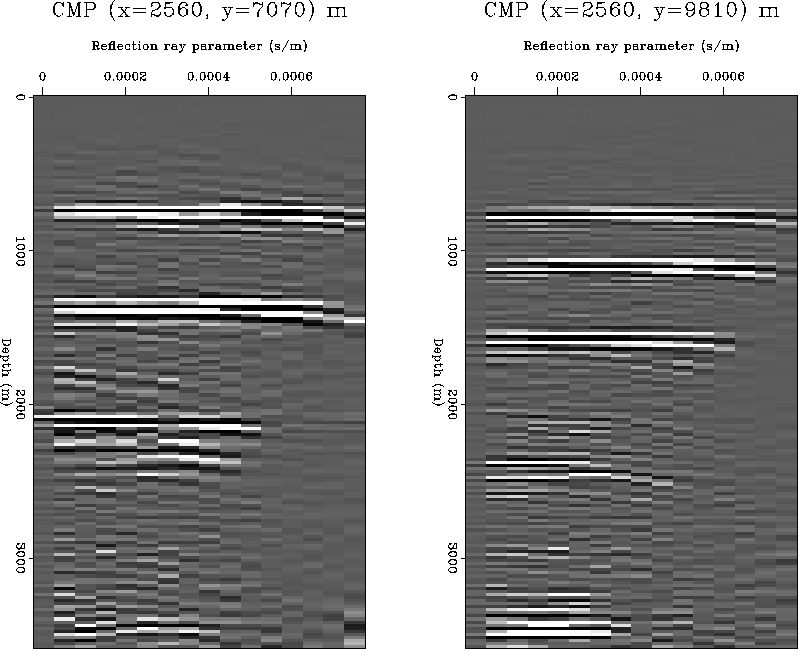
Figure 11 shows
the CIG gathers taken at both problematic locations.
The gather on the left shows some coherent energy
for the poorly imaged reflections,
though the energy is not perfectly aligned
along the ray-parameter axis.
The gather on the right shows no coherent
energy corresponding to the poorly imaged fault,
suggesting a worse imaging problem for this case.
Vel-salt-x2560
Figure 9
Velocity model at constant in-line coordinate x=2,560 m.


Both-salt-under-x2560
Figure 10
Kirchhoff migration (a) and common-azimuth migration (b)
at constant in-line coordinate x=2,560 m.
Both sections are rendered using the same (98) percentile for
clipping amplitudes.


AVO-salt-7070-9810-x2560
Figure 11
Angle-domain Common Image Gathers obtained by common-azimuth
migration.
The location of these CIGs are marked
on the in-line axis of the common-azimuth image shown in
Figure 10


Next: Conclusions
Up: Biondi: Subsalt imaging by
Previous: SEG/EAGE Salt data set
Stanford Exploration Project
4/20/1999
