|
|
|
|
Decon in the log domain - practical considerations |
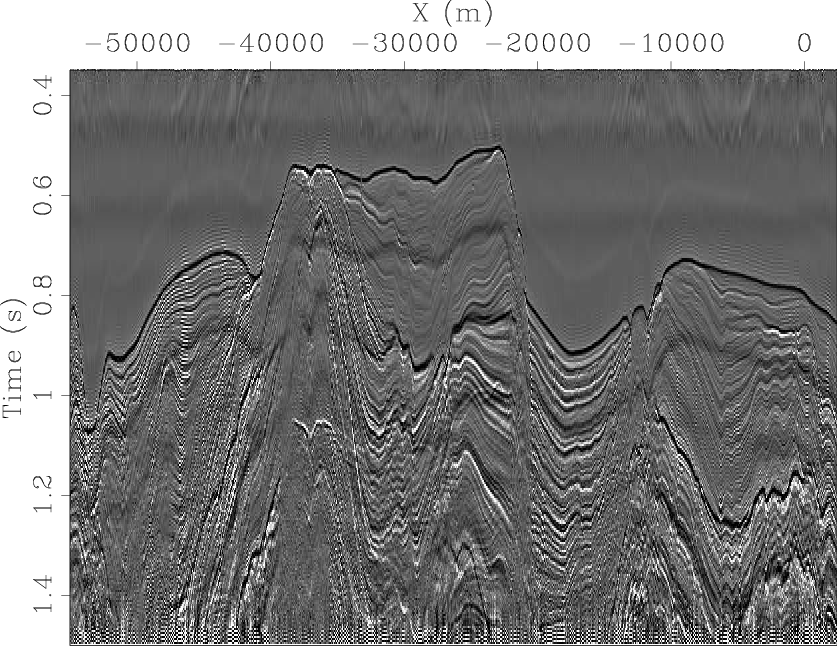
Figure 5(a) is the result of applying the gained input deconvolution to the offset group without regularization, and then windowing out the near offset only for display. Compared to the same process applied to the near offset only (Figure 2(a)), the polarity of the reflections is incorrect, and the precursor is stronger. We can also see a low frequency precursors in the water. The deconvolution has spiked the Ricker on its second negative lobe.
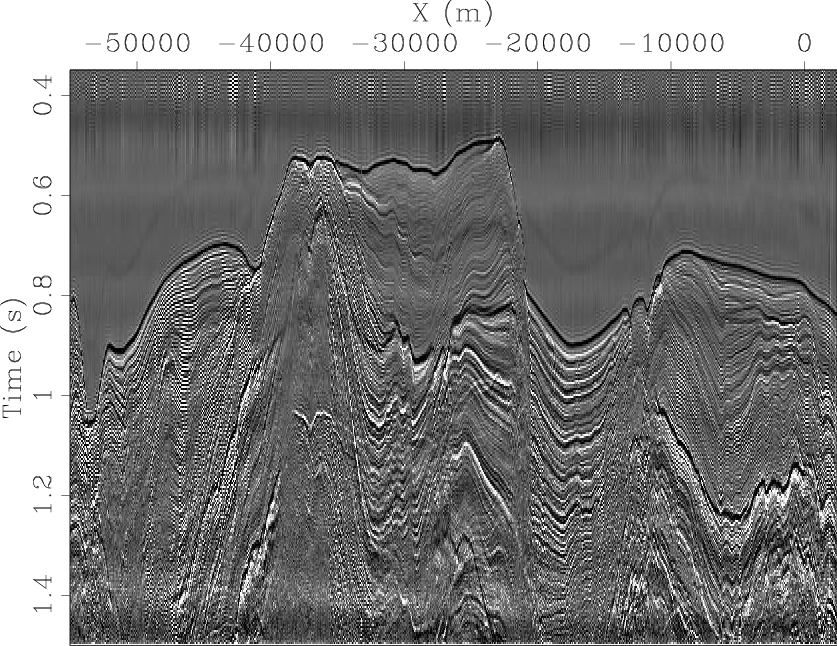
Figure 5(b) is the result of applying the gained output deconvolution to the offset group without regularization. When compared with Figure 2(b), the polarity of the reflections is again wrong, but the precursor is weaker. The low-frequency precursor is visible here too. In this case, the deconvolution has spiked the Ricker on its first negative lobe.
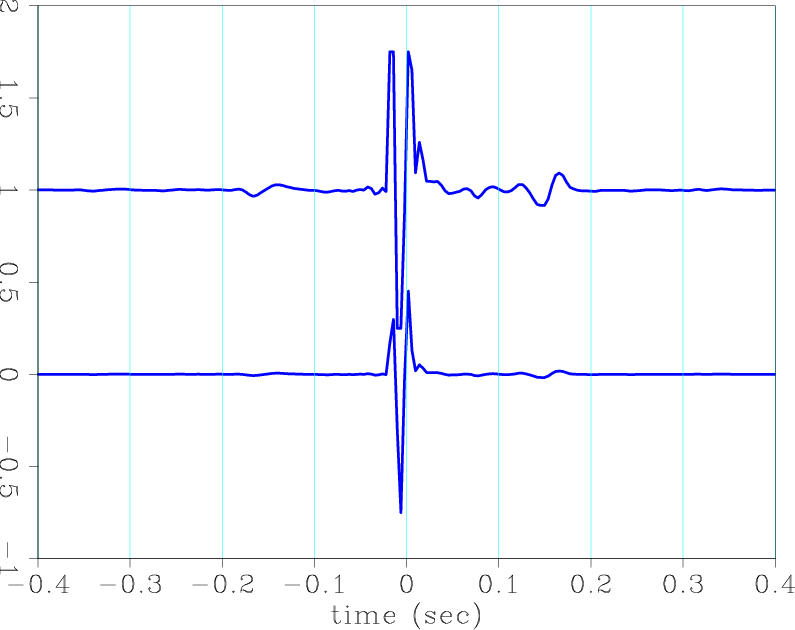
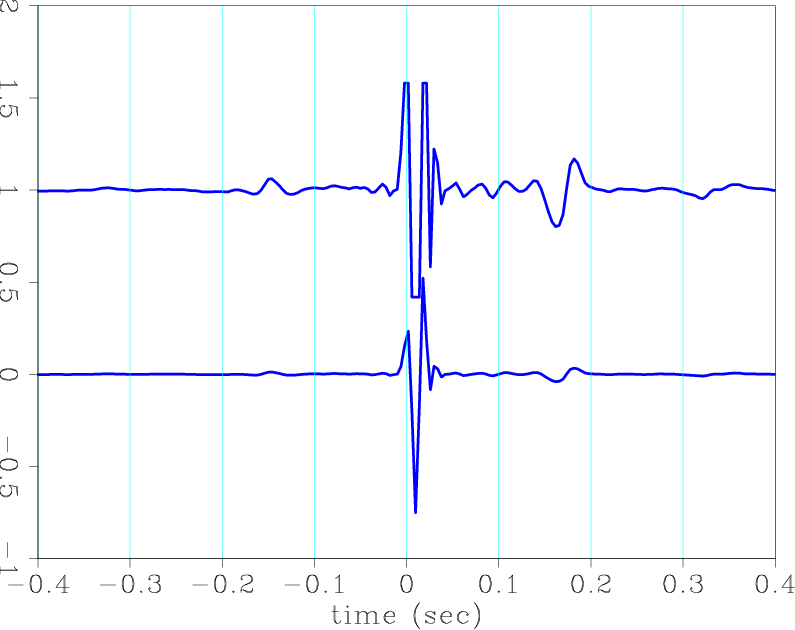
The respective estimated shot waveforms are shown in Figures 7(a) and 7(b). Note the shift of the negative spike about the zero-lag in these two figures. Note also the low frequency (visible in the clipped traces) in the anti-causal part of the shot waveforms. These results show that for the range of offsets chosen here, requiring the inversion to produce the sparsest output does not result in the correct shot waveform. The interpretation of these results is that the shot waveform varies over this offset range. This change is sufficient to have the inversion produce a shot waveform that on average creates the sparsest output when it is deconvolved with the data.
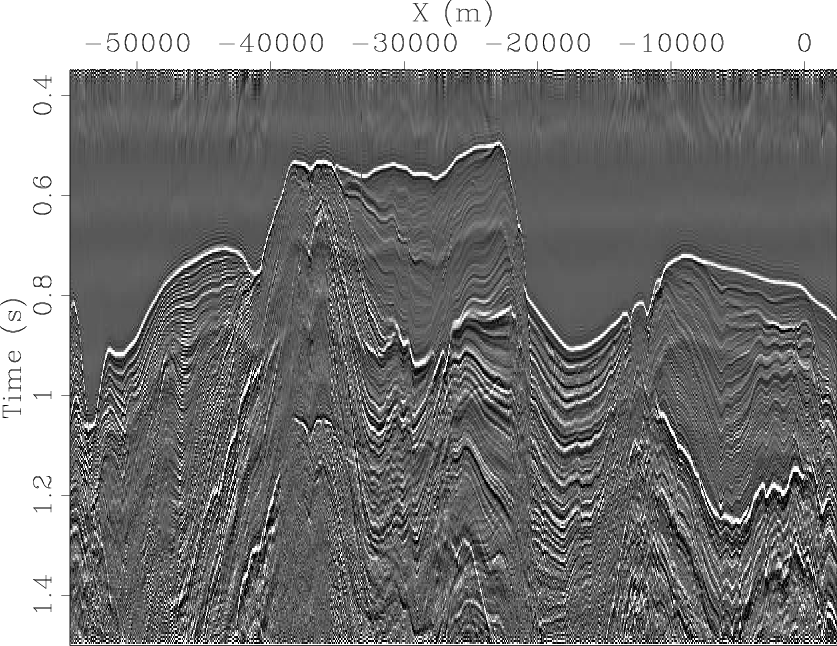
Figure 6(a) is the result of gained input deconvolution with regularizations on the offset group. Compared to Figure 5(a), we can see how the polarity of the reflections is now correct, and also that the precursor is weaker. The bubble however, has not been eliminated.
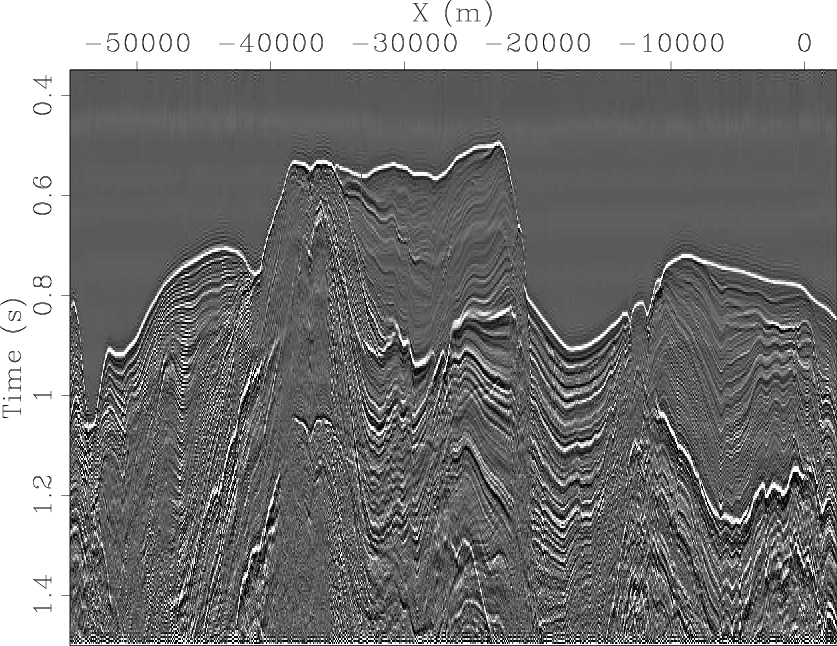
Figure 6(b) is the gained output deconvolution with regularizations. For this figure, we see spiking with the correct polarity. The precursors are much weaker than the gained input result in Figure 6(a). The bubble has been strongly attenuated, though not as well as in Figure 4(d).
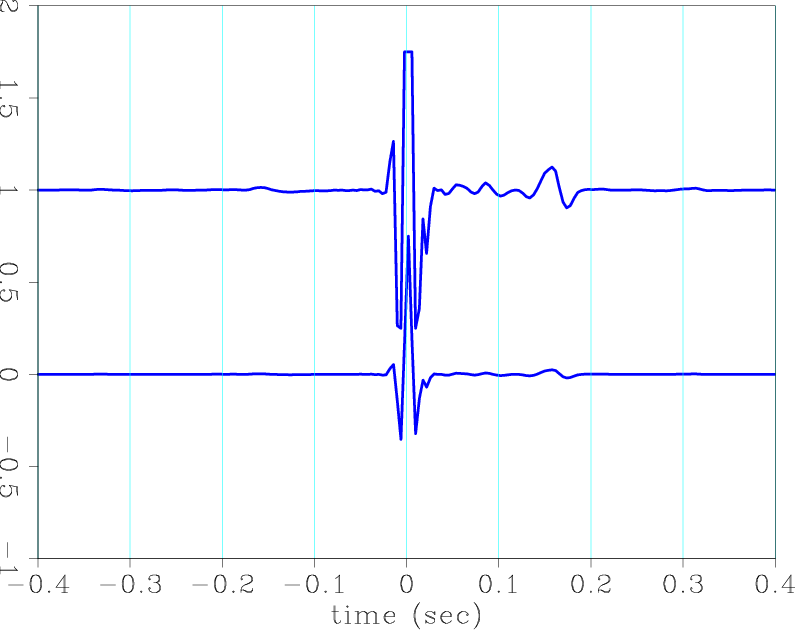
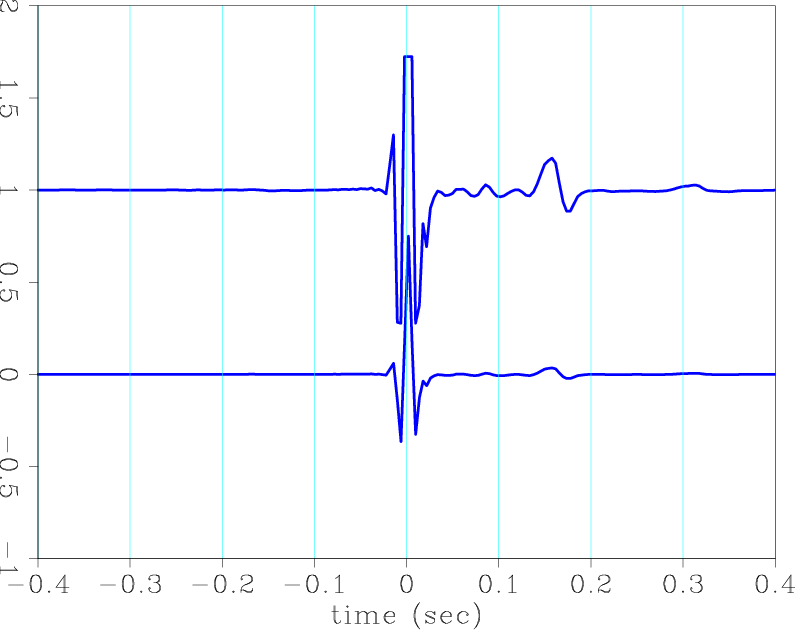
Figures 7(c) and 7(d) are the estimated shot waveforms of the regularized gained input and gained output deconvolutions, respectively. The central Ricker wavelet is almost identical between them, but there are slight differences in the estimated bubble. There is just a hint of stronger anti-causal coefficients in Figure 7(c). Observing the obvious differences in the decon results, we can see why these slight differences are important.
|
|---|
|
deconEW05g-t0-6,deconEW05g-t2-6
Figure 5. Deconvolution of offset group (180m - 1180m). (a) Gained input deconvolution without regularization. (b) Gained output deconvolution without regularization. The deconvolution was applied to all offsets in the range, but only the 180m offset deconvolution result is displayed. Note that the wavelet was spiked on a negative lobe. The bubble is still prominent, and there are strong low-frequency precursors in the water. |
|
|
|
|---|
|
deconEW05g-t0-reg-6,deconEW05g-t2-reg-6
Figure 6. Deconvolution of offset group (180m - 1180m). (a) gained input deconvolution with regularization. (b) gained output deconvolution with regularization. The deconvolution was applied to all offsets in the range, but only the 180m offset deconvolution result is displayed. Note how with regularization, both have been spiked on the central positive lobe of the Ricker wavelet. The precursors have been removed. The bubble is better removed in (b). |
|
|
|
|---|
|
EW05g-t0-6,EW05g-t2-6,EW05g-t0-reg-6,EW05g-t2-reg-6
Figure 7. Estimated shot waveforms resulting from inversion using offset group. In each graph, the lower trace is unclipped, and the upper trace is clipped to enhance the small coefficients. (a) Gained input decon without regularization. (b) Gained output decon without regularization. (a) and (b) are shot waveforms, the inverses of which generated Figures 5(a) and 5(b) after deconvolution. In both cases, the main lobe has the wrong polarity. In (a) it is before zero-lag, and in (b) it is after zero-lag. (c) Gained input decon with regularization. (d) Gained output decon with regularization. (c) and (d) are shot waveforms, the inverses of which generated Figures 6(a) and 6(b) after deconvolution. Note how regularization helped to generate a more correct shot waveform, with much weaker precursors. |
|
|
|
|
|
|
Decon in the log domain - practical considerations |