|
|
|
|
Earthquake extraction and correlation energy at Long Beach, California seismic survey |
 Hz low-pass filter.
|
yorbalinda-snap
Figure 2. Snapshot of the interpolated waveform generated from the M  Yorba Linda, CA event, roughly
 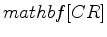 km east of the Long Beach survey.
|
|
|---|---|
|
|
|
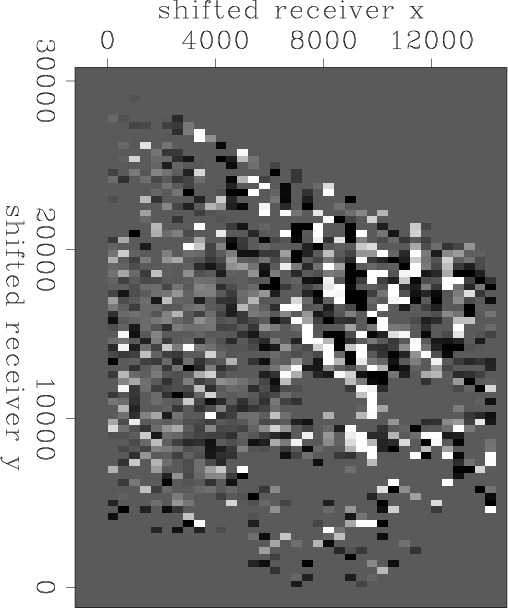
yorbalinda-snap-bp
Figure 3. Same snapshot as Figure 2 but after applying a
Hz low-cut filter.
|
|
|---|---|
|
|
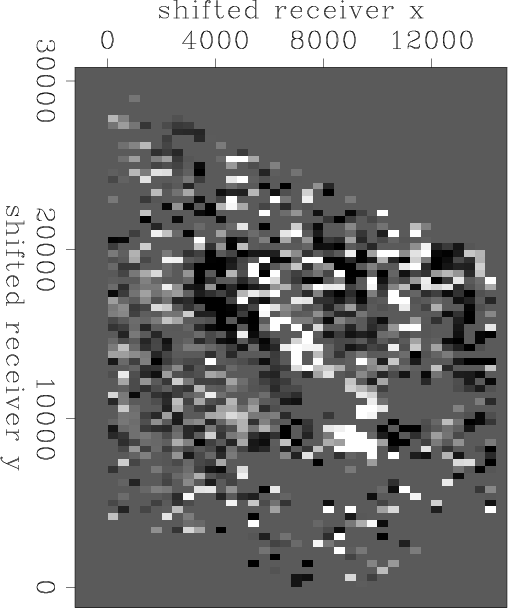
Figure 4 shows an unfiltered snapshot from the relatively far Mexicali event, while Figure 5 shows the same snapshot after we applied a  Hz low-pass filter.
|
mexicali2-snap
Figure 4. Snapshot of the interpolated waveform generated from the M  Mexicali, Mexico event, roughly
  km southeast of the survey.
|

|
|---|---|
|
|
|
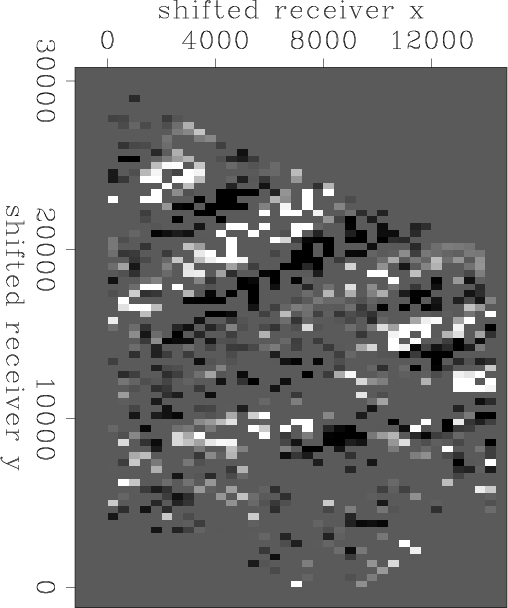
mexicali2-snap-bp
Figure 5. Same snapshot as Figure 4 but after applying a
Hz low-cut filter.
|
|
|---|---|
|
|
In both unfiltered snapshots (Figures 2 and 4), the incoming waveforms are distinguishable. However, when low-pass filtered (Figures 3 and 5) these waveforms are even easier to identify. This suggests that we are seeing surface waves (and perhaps S-waves), which are more prevalent at lower frequencies, rather than P-waves. Research by Yang and Ritzwoller (2007) and Tanimoto and Sheldrake (2002) have shown that surface waves can be used for resolving velocity structure at the crustal scale. With the denser station spacing of the Long Beach array, nearby and teleseismic events can potentially be useful for resolving structures and velocities at the reservoir scale.
|
|
|
|
Earthquake extraction and correlation energy at Long Beach, California seismic survey |