|
|
|
|
Interactive processing: Geometry manipulation |
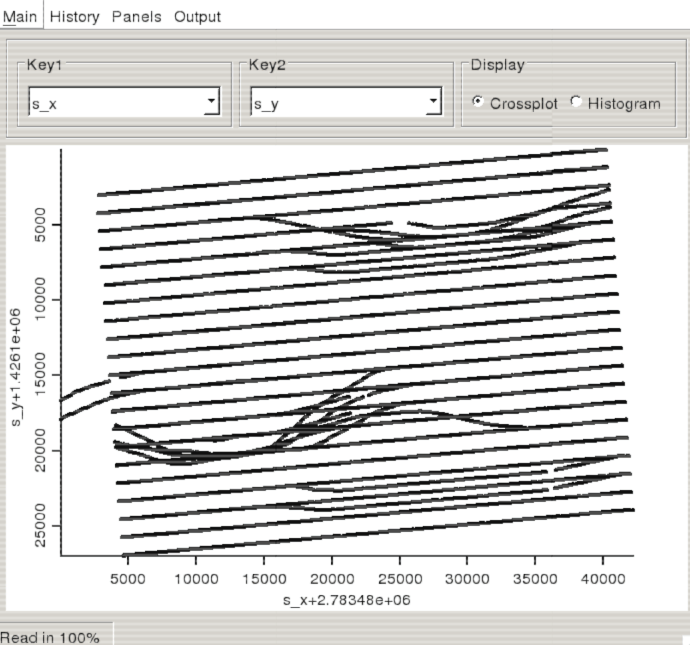
There are three windows in qthead. The main window gives a graphical display of one or more headers. The desired header can be selected from a pull down menu at the top of the display (see Figure 1). In this display the user can window a range of headers by drawing a box using the left mouse button. The right mouse button can be used to draw a line which will be used to rotate the data. After rotation the selected line will be horizontal in the display.
|
|---|
|
cross-plot
Figure 1. An example of the cross-plot view. In this case we see the source locations displayed. Note the ability to select the headers to be displayed at the top of the figure along with the ability to switch between a cross-plot and histogram view. |
|
|
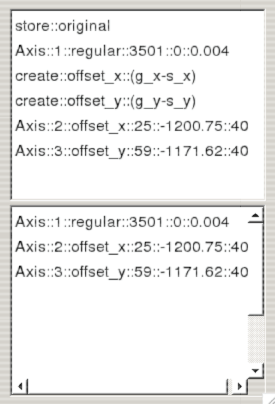
The second window (see Figure 2) displays all of the actions that have been performed on the data such as rotating and windowing. The user can undo an action by selecting the action above it in the list using the left mouse button. The application will then rerun all of the processing steps above and including the selected action. The bottom portion of the window is the gridding parameters that the user has selected for the dataset. These can be set in the final window.
|
history
Figure 2. A view of the history panel. Each command can be clicked on, erasing all future processing steps. The display is then recreated by running all commands before and including the selected command. |
|
|---|---|
|
|
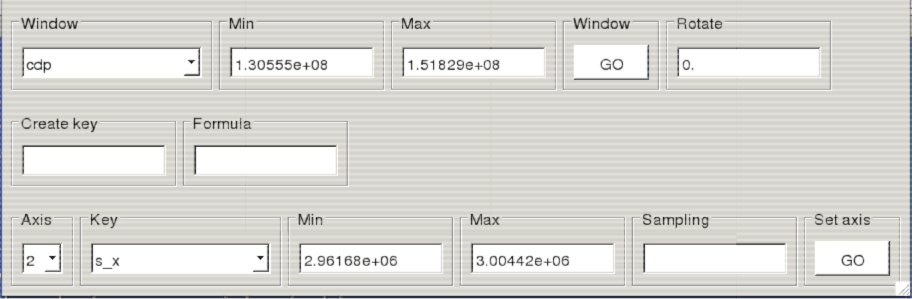
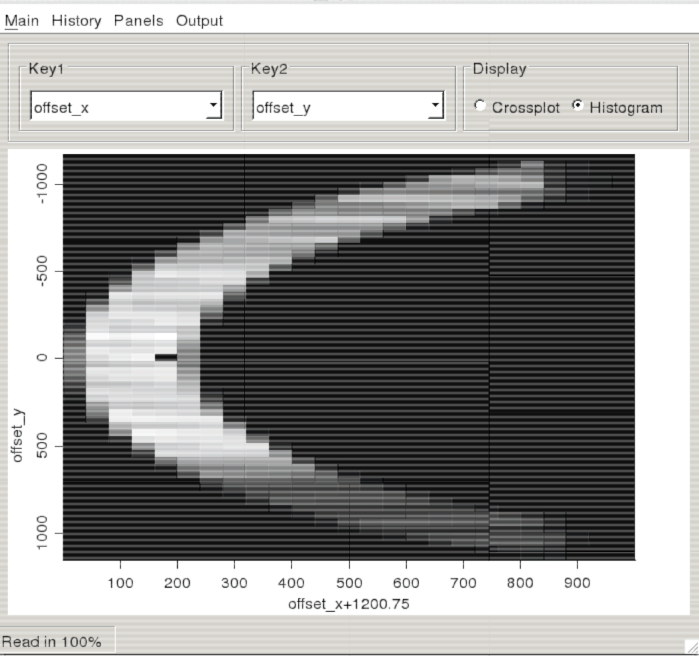
The first two rows of the final window (see Figure 3) allow the user to specify exact windowing parameters for the data and an exact rotation angle (instead of using the mouse approach used in the main window). In addition, the user can create new headers keys by entering the new key name and its formula using constants and other key values. The final row allows the user to add a gridding axis to the dataset. The minimum and maximum of each key are provided by the program, the user adds the sampling then uses the go button to create the axis. Once an axis has been created the user has the option of choosing to change the main window display from a cross plot to a multi-dimensional histogram (see Figure 4).
|
|---|
|
head-manip
Figure 3. The header manipulation panel. From this panel keys can be windowed and rotated using the keyboard inputs. In addition new keys can be created by entering a formula based on constants and other keys. The bottom row allows gridded axes to be created from a selected key. |
|
|
|
|---|
|
histogram
Figure 4. An example of the histogram view. In this case two offset keys have been created and the data binned at 40m. Darker colors indicate more traces falling into a bin. |
|
|
The main window panel provides additional functionality using drop-down menus. The user can store all of the commands in the history buffer to a file. A history buffer can also be read from disk, and the actions in it performed automatically. The user also has several different output options. The user can output all of the SEP3D commands that will produce a SEP3D dataset equivalent to the current display. The user can also directly create the volume using the Create regular volume or Create irregular volume. The difference between these two options is whether to create a regular cube (requires that gridding axes have been created) or an irregular volume.
|
|
|
|
Interactive processing: Geometry manipulation |