|
|
|
|
Early-arrival waveform inversion: Application to cross-well field data |
The two wells used to acquire this dataset are located very close together, only  feet apart. One well penetrates an anomalous zone, but the other one missed the zone. The anomalous zone contains massive reservoir-quality carbonate, as suggested by the first well. However, surface seismic data in the same area has insufficient resolution to determine the vertical and horizontal extent of the zone. To more accurately identify the boundary of the zone, a cross-well survey was conducted between these two wells.
The cross-well data were collected with a piezoelectric cylindrical bender source and hydrophone receivers in the depth range of  -
- ft (
ft (  -
- m). A total of 201 source levels were spaced at
  ft (
ft ( m) depth intervals, and 203 receiver levels were also spaced
ft apart. This resulted in a raw data set with about
m) depth intervals, and 203 receiver levels were also spaced
ft apart. This resulted in a raw data set with about  traces. The input signal was a
  -
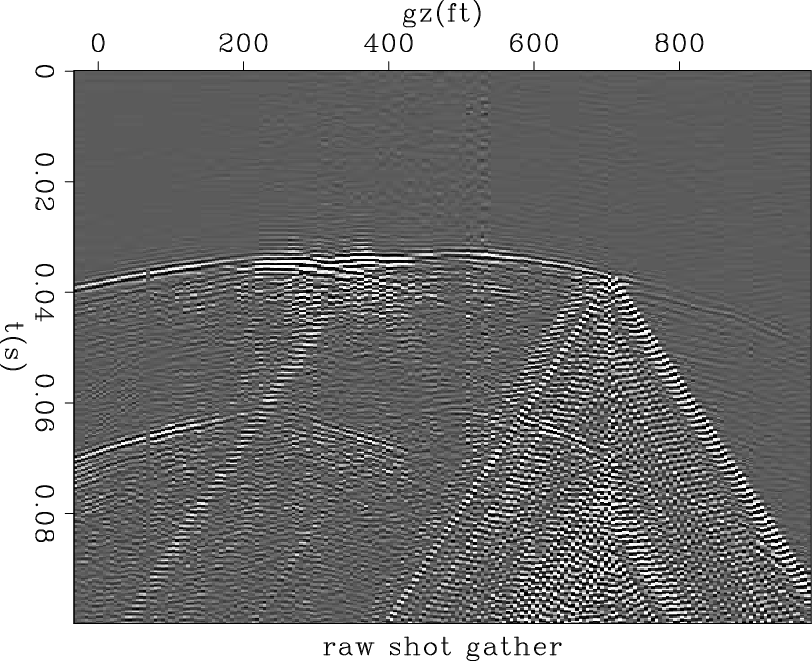
- Hz linear upsweep (Langan et al., 1997). Details of the acquisition system and the techniques employed can be found in (Harris et al., 1995). The data retrieved have a relatively good signal-to-noise ratio. The only strong coherent noise is the tube wave that exists in all shot records (Figure 1), which is caused by potential leakage in the receiver well.
|
shot
Figure 1. Typical shot gather from the field cross-well dataset. Notice the strong tube wave in the right part of the shot gather. |
|
|---|---|
|
|
Previous result from ray-based methods (Langan et al., 1997) is very smooth, and did not identify the boundary of the zone very well. To better define the boundary, we apply early-arrival waveform inversion (Tarantola, 1984; Pratt et al., 1998; Mora, 1987) to the dataset.
|
|
|
|
Early-arrival waveform inversion: Application to cross-well field data |