|
|
|
|
Continuous monitoring by ambient-seismic noise tomography |
 Hz, which is common for active seismic data. However, these long and continuous recordings are not perfect; they are contaminated with data glitches, electronic noise, and other noise bursts. It is best to deal with these imperfections before any further processing, because they can cause strong filtering artefacts. The next step is to bandpass the data for the frequency range of interest (
 Hz), which is considerably lower than the frequency range of active seismic imaging. For recordings at Valhall, this part of the frequency spectrum is fairly clean (see Figure 2), especially far from the platforms.
These data are divided into blocks of 30 minutes with  overlap between adjacent blocks and multiplied with a cosine-squared taper. This taper has the advantage of restitching the data together without amplification, according to the Pythagorean trigonometric identity. Each 30 minute block is bandpassed (for
Hz) and subsampled by a factor of 50 to a sample frequency of
overlap between adjacent blocks and multiplied with a cosine-squared taper. This taper has the advantage of restitching the data together without amplification, according to the Pythagorean trigonometric identity. Each 30 minute block is bandpassed (for
Hz) and subsampled by a factor of 50 to a sample frequency of  Hz. The data is not restitched, instead, the 30 minutes of data are cross-correlated between each station pair, delivering one EGF for each station pair. For all data in the December 2010 recording, this gives 486 EGFs for each station pair.
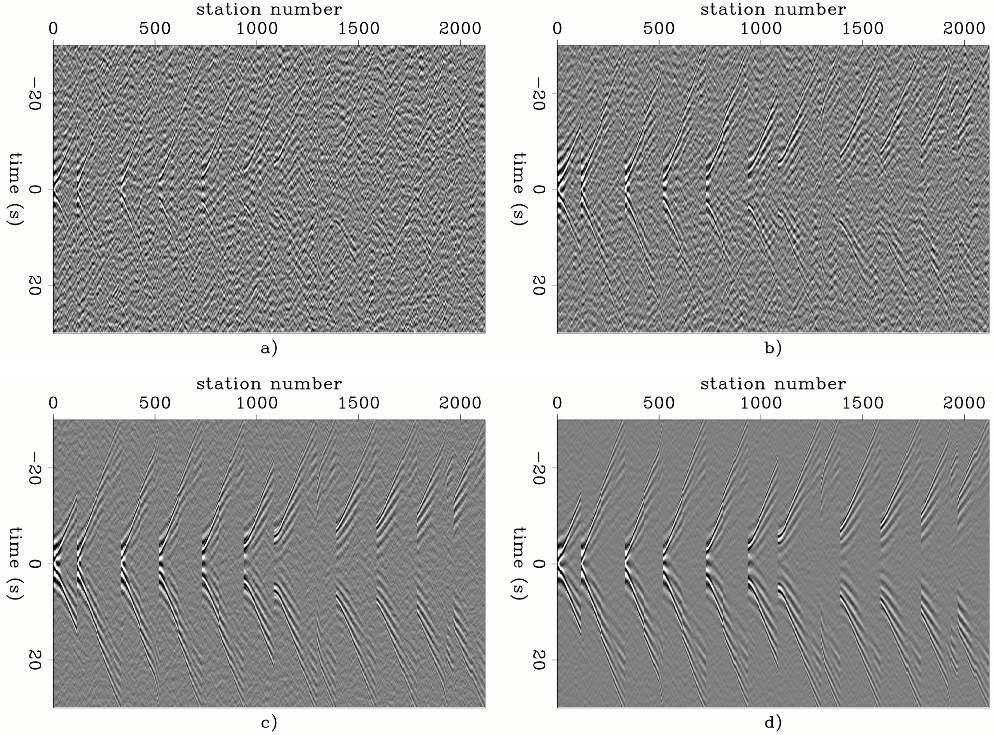
Figure 6a) shows one such estimate for all stations cross-correlated with station 1, Figure 6b) shows the mean of all estimates for  hours, Figure 6c) shows the mean of all estimates for
  day, and Figure 6 shows the mean of all estimates for a little over
  days. In each individual estimate there is little signal that exceeds the background correlation fluctuations. However, as we stack more estimates and thus increase the effective recording time we cross-correlate, over arrivals start standing out from the background correlation fluctuations. These arrivals correspond to the surface-wave Green's function between all stations and station 1.
|
|---|
|
stacks4
Figure 6. Four virtual seismic sources generated by cross correlating recordings of ambient seismic noise; a)  hour of recordings, b)
hours of recording, c)
day of recording, d)
days of recording.
hour of recordings, b)
hours of recording, c)
day of recording, d)
days of recording.
|
|
|
|
|
|
|
Continuous monitoring by ambient-seismic noise tomography |