|
|
|
|
Elastic Born modeling in an ocean-bottom node acquisition scenario |
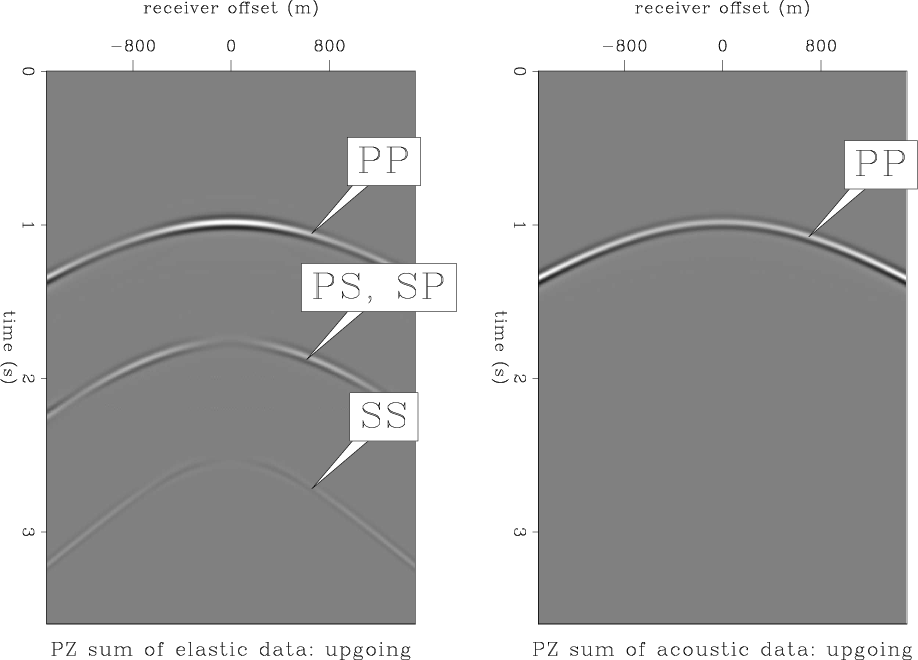
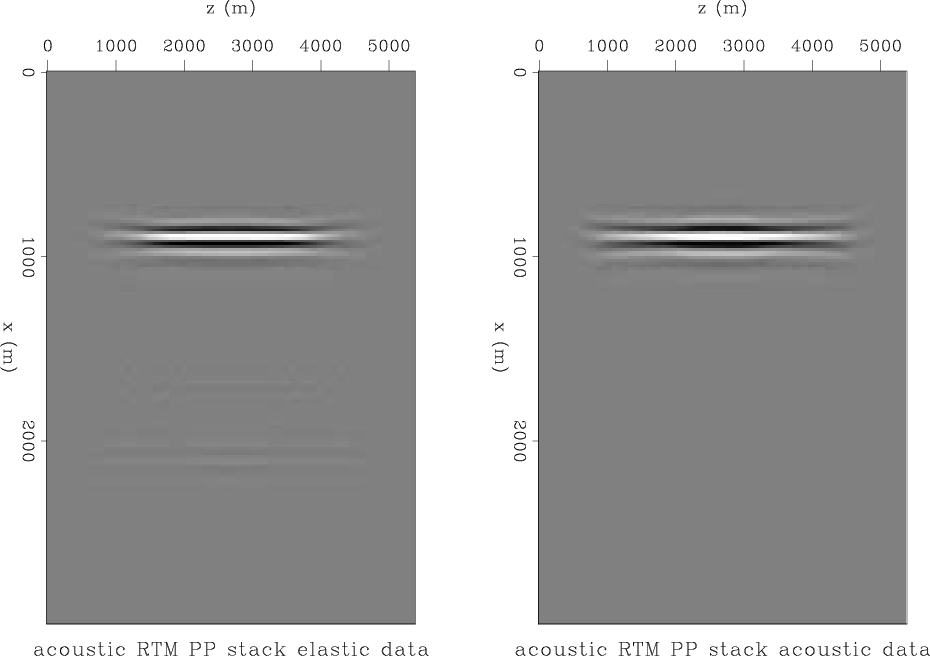
PZ summation operates on the hydrophone and the vertical geophone component. Looking at figure 5, we can see that were we to use PZ summation, the PS and the SS arrivals would be introduced into the summation result. This effect is shown in the left panel of Figure 7. I scaled the geophone data to match the first reflection event of the hydrophone data (which is a PP reflection), and then took the average of the vertical geophone and hydrophone, which is equivalent to applying equation 1. In a standard processing flow, this result of PZ summation would be treated as acoustic data, and migrated with an acoustic velocity. The left panel of Figure 8 is the result of acoustic reverse time propagation of the PZ-summed hydrophone data, followed by a cross-correlation with an acoustically propagated source wavefield, and then a stacking over sources to improve the signal-to-noise ratio. The source and receiver wavefields are propagated with a smooth velocity model so that no receiver-side multiples are generated. Two artifacts are visible below the true reflector position. These artifacts come from the cross-correlation of the SS and the PS reflection events, which were brought into the acoustic data by PZ summation, with the acoustic source wavefield.
In a perfectly acoustic medium, the result of PZ summation would be just the PP reflection event, as can be seen on the right panel of Figure 7. Executing acoustic RTM with a smooth acoustic velocity model and the right panel of Figure 7 as input, we get the artifact-free image on the right panel of Figure 8.
|
|---|
|
0Pr-up-acous-vs-elas
Figure 7. Result of PZ summation of elastically generated data (top) vs. acoustically generated data. The summation introduces the non-P energy into the upgoing data. |
|
|
|
|---|
|
elastic-and-acoustic-stack
Figure 8. Comparison of the image generated by acoustic RTM of the synthetic acoustically-generated data (right) vs. acoustic RTM of the synthetic elastically-generated data (left). The images have been gained by the square of the depth and clipped at 99.7%. PZ summation is applied to the hydrophone and the vertical geophone, and the result is injected as hydrophone data only (pressure wave). Two artifacts can be seen in the migration result of the elastic data. |
|
|
|
|
|
|
Elastic Born modeling in an ocean-bottom node acquisition scenario |