|
|
|
|
Two-parameters residual-moveout analysis for wave-equation migration velocity analysis |
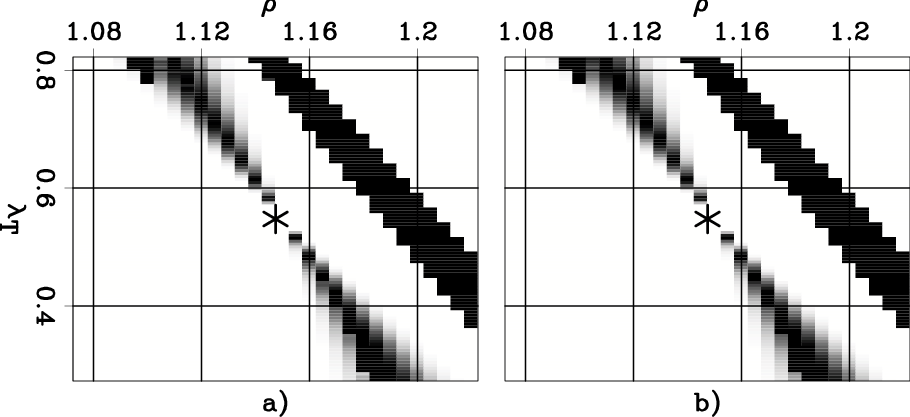
Figure 10
shows the zooms into the plots shown in
Figure 5;
that is, comparing the correlation function
for the first CIG (velocity anomaly) obtained
using the ``Taylor'' RMO function
(Figure 10a)
and the conventional one-parameter RMO function
(Figure 10b).
I set the width of the close up windows to be equal to the distance
of the maximum from the starting CIG;
that is, the difference between the
minimum and the maximum value of the ![]() parameter is
parameter is
![]() and the difference between the
minimum and the maximum value of the
and the difference between the
minimum and the maximum value of the ![]() parameter is
parameter is
![]() .
The two plots shown in Figure 10
are almost identical, indicating that in this case there
would be a negligible advantage to be gained by employing a
two-parameter RMO function.
.
The two plots shown in Figure 10
are almost identical, indicating that in this case there
would be a negligible advantage to be gained by employing a
two-parameter RMO function.
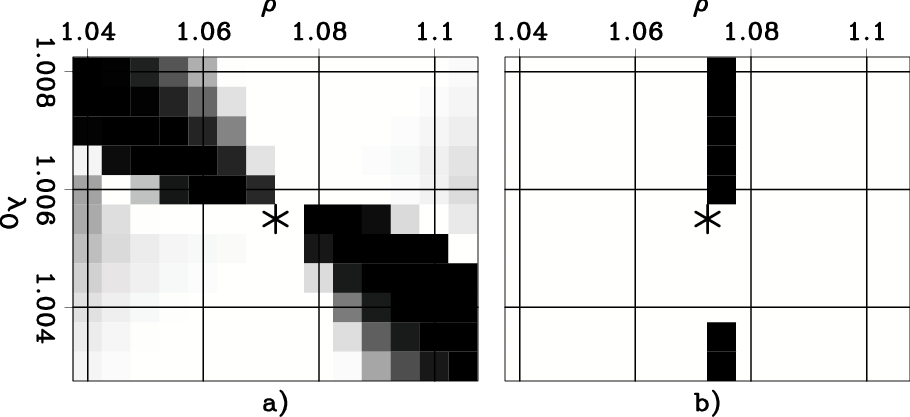
Figure 11 analyze the application of the ``Orthogonal'' RMO function to the same CIG as the previous figure. It shows the zooms into the plots shown in Figure 7b and Figure 6b, respectively. I set the window width following the same criterion described above for the ``Taylor'' RMO function. In this case, the one-parameter RMO function seems to provide better local convergence than the two-parameter RMO function.
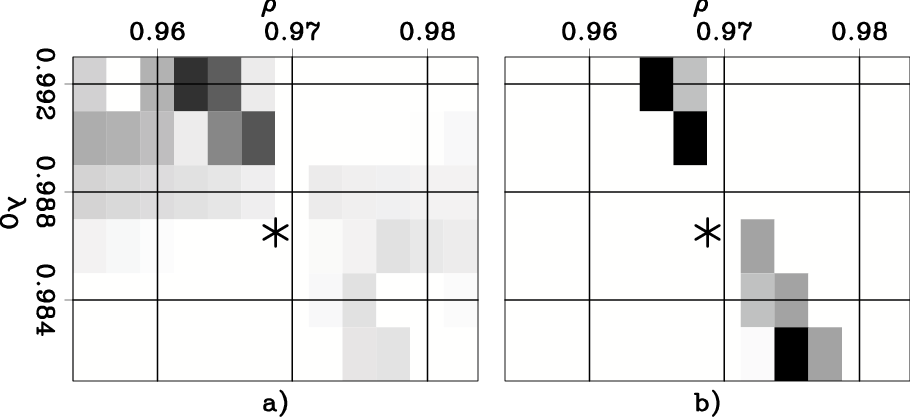
The last two figures, Figure 12 and Figure 13, show similar analysis as the previous two, but applied to the CIG that suffers from the effects of anisotropy. For these CIG the two-parameters RMO function provides a better local convergence than the one-parameter function. The improvements look more substantial for the ``Orthogonal'' RMO function than for the ``Taylor'' RMO function.
|
Zoom-CorrShift-TP
Figure 10. Zooms into the correlation functions shown in Figure 5. |
|
|---|---|
|
|
|
Zoom-CorrShift-OP-narrow
Figure 11. Zooms into the correlation functions shown in Figure 7b and Figure 6b, respectively. |
|
|---|---|
|
|
|
Zoom-CorrShift-TP-aniso
Figure 12. Zooms into the correlation functions shown in Figure 8. |

|
|---|---|
|
|
|
Zoom-CorrShift-OP-aniso
Figure 13. Zooms into the correlation functions shown in Figure 9. |
|
|---|---|
|
|
|
|
|
|
Two-parameters residual-moveout analysis for wave-equation migration velocity analysis |