Schematics of Transmission, Reflection, and Reverberation (Chin et al.)

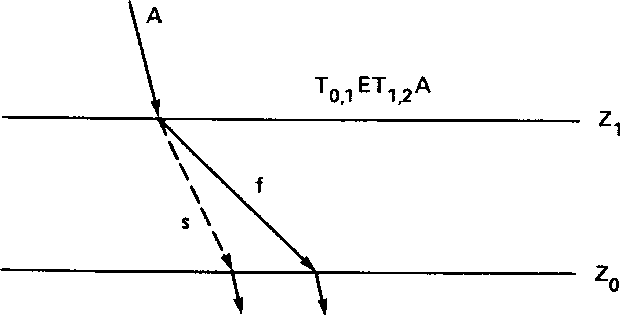
Figure 1. Schematic diagram of the significance of T0,1ET1,2A
for an input pulse slightly off of normal incidence.

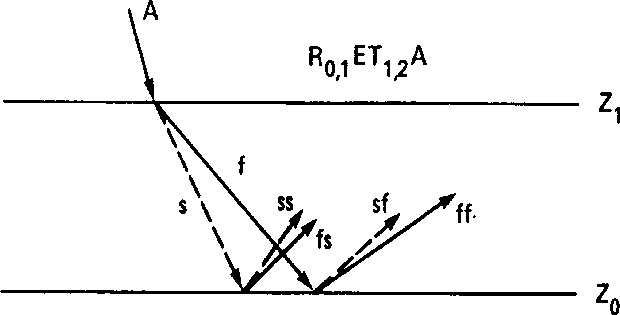
Figure 2. Schematic diagram of the significance of R0,1ET1,2A
for an input pulse slightly off of normal incidence.

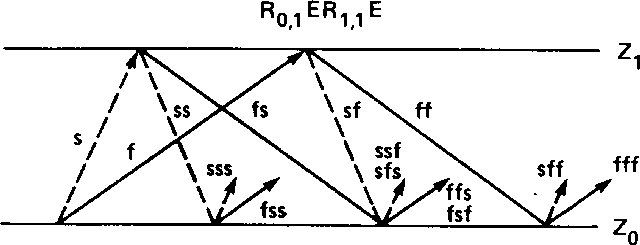
Figure 3. Schematic diagram of the significance of the reverberation matrix R0,1ER1,1E
resulting from an input pulse slightly off of normal incidence.


