![[*]](http://sepwww.stanford.edu/latex2html/cross_ref_motif.gif) .
In the remainder of the paper, we discuss only the values
obtained by Experiment 3, which represents the median data set.
.
In the remainder of the paper, we discuss only the values
obtained by Experiment 3, which represents the median data set.
The experimental setup was arranged for us by Hezhu Yin and the Stanford Rock
and Borehole Group (SRB). We used the
setup parameters described above to make the following measurements:
¶ and § waveform first-break times and and waveform amplitudes
and . The first-break times were picked at the zero-crossing of the
onset of the waveform, and the amplitudes were measured from the first
positive peak trailing the negative first motion of the arriving waveform.
Each of the four of us made independent measurements, and all of our
individual Massillon sandstone values are plotted in Figure ![[*]](http://sepwww.stanford.edu/latex2html/cross_ref_motif.gif) .
In the remainder of the paper, we discuss only the values
obtained by Experiment 3, which represents the median data set.
.
In the remainder of the paper, we discuss only the values
obtained by Experiment 3, which represents the median data set.
(1)
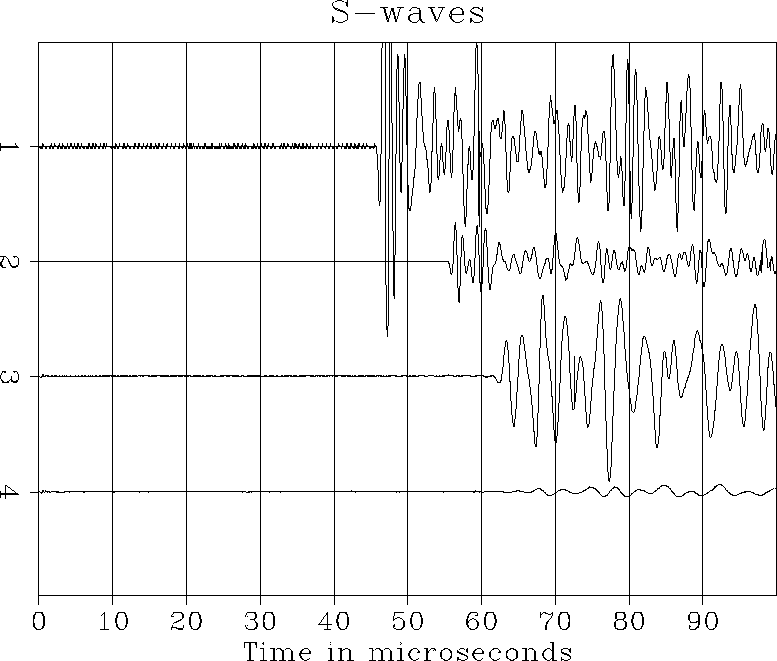
We measured the source-receiver transducer delay times for the ¶
and § modes, in the absence of any rock samples. This gave values of
= 23.30 ![]() .05 and = 45.80
.05 and = 45.80 ![]() .05 .
The pulse amplitudes, at 20 dB gain, were = 4.72 V and = 6.08 V.
The ¶ and § waveforms are plotted as
trace 1 of Figures
.05 .
The pulse amplitudes, at 20 dB gain, were = 4.72 V and = 6.08 V.
The ¶ and § waveforms are plotted as
trace 1 of Figures ![[*]](http://sepwww.stanford.edu/latex2html/cross_ref_motif.gif) and
and ![[*]](http://sepwww.stanford.edu/latex2html/cross_ref_motif.gif) .
.
(2)
We made a reference velocity measurement on a stainless-steel plug,
using honey to get good coupling between the source and receiver transducers.
This gave values of = 28.55 ![]() .05 and = 55.55
.05 and = 55.55 ![]() .05 .
The length of the plug was measured to be 1.187
.05 .
The length of the plug was measured to be 1.187 ![]() 0.001 inches.
We measured the pulse amplitudes at 20 dB gain
to be = 2.16 V and = 2.24 V.
The ¶ and § waveforms are plotted as
trace 2 of Figure
0.001 inches.
We measured the pulse amplitudes at 20 dB gain
to be = 2.16 V and = 2.24 V.
The ¶ and § waveforms are plotted as
trace 2 of Figure ![[*]](http://sepwww.stanford.edu/latex2html/cross_ref_motif.gif) and Figure
and Figure ![[*]](http://sepwww.stanford.edu/latex2html/cross_ref_motif.gif) .
.
(3)
Next, we made velocity measurements on a core of dry Massillon Sandstone.
The weak s/n ratio of these waveforms required 40 dB gain on the amplifier.
The waveforms were not generally as clean as previously, probably due
to some honey being absorbed by pores at the rock sample end surfaces.
We picked the ¶-wave first-break time to be at = 33.65 ![]() .10 ,
and the §-wave time at = 63.25
.10 ,
and the §-wave time at = 63.25 ![]() 1.00 . The large uncertainty
in is due to the complicated § waveform, probably obscured somewhat
by ¶-§ conversions, and ¶-wave edge diffractions off the end of the rock
sample core.
The length of the core was measured to be 1.189
1.00 . The large uncertainty
in is due to the complicated § waveform, probably obscured somewhat
by ¶-§ conversions, and ¶-wave edge diffractions off the end of the rock
sample core.
The length of the core was measured to be 1.189 ![]() 0.001 inches.
The waveform amplitudes, at 40 dB gain, were measured to be = 25.60 mV
and = 96.00 mV, with similar uncertainty concerns as mentioned above.
The ¶ and § waveforms are plotted as
trace 3 of Figure
0.001 inches.
The waveform amplitudes, at 40 dB gain, were measured to be = 25.60 mV
and = 96.00 mV, with similar uncertainty concerns as mentioned above.
The ¶ and § waveforms are plotted as
trace 3 of Figure ![[*]](http://sepwww.stanford.edu/latex2html/cross_ref_motif.gif) and Figure
and Figure ![[*]](http://sepwww.stanford.edu/latex2html/cross_ref_motif.gif) .
.
(4)
Next, we made measurements on a water-saturated core of Massillon Sandstone.
Again, we saw a lot of waveform distortion and contamination, particularly
for the §-waves, and we needed to use 40 dB gain on the amplifier.
The first-break times were picked to be = 32.25 ![]() .20 ,
and = 63.15
.20 ,
and = 63.15 ![]() 2.00 . The large uncertainty is due to
the complex waveform we had to interpret.
The length of the core was measured to be 1.191
2.00 . The large uncertainty is due to
the complex waveform we had to interpret.
The length of the core was measured to be 1.191 ![]() 0.001 inches.
The amplitudes, at 40 dB amplifier gain, were picked with
a similar amount of waveform uncertainty: = 10.40 mV, and = 6.40 mV.
The ¶ and § waveforms are plotted as
trace 4 of Figure
0.001 inches.
The amplitudes, at 40 dB amplifier gain, were picked with
a similar amount of waveform uncertainty: = 10.40 mV, and = 6.40 mV.
The ¶ and § waveforms are plotted as
trace 4 of Figure ![[*]](http://sepwww.stanford.edu/latex2html/cross_ref_motif.gif) and Figure
and Figure ![[*]](http://sepwww.stanford.edu/latex2html/cross_ref_motif.gif) .
.
 |
 |