


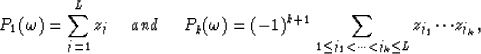
Next: THE PROGRAM
Up: Balog: Interpolation
Previous: Introduction
In the discussion to follow the predictability of linear events in the  domain and a relation between the filters predicting the original and the interpolated data will be presented.
This theoretical work is derived in the papers by Spitz and Canales (Spitz, 1991, Canales, 1984).
domain and a relation between the filters predicting the original and the interpolated data will be presented.
This theoretical work is derived in the papers by Spitz and Canales (Spitz, 1991, Canales, 1984).
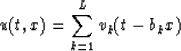
The data u(t,x) is assumed to be a collection of N equally spaced traces that is composed of linear events corresponding to L distinct dips, with L< N.
In the case when several lines are parallel, they are treated as part of a single event with a unique dip.
It is also assumed that there is no time aliasing and that the signals are invariant along the linear events.
Following Canales (Canales, 1984) and with these assumptions, the data can be expressed in the (t,x) domain as
|  |
(1) |
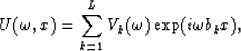
or in the domain after a Fourier transform over the time axis as
|  |
(2) |
where vk(t) is a wavelet,  its Fourier transform and bk is a measure of the slope, all corresponding to the kth linear event.
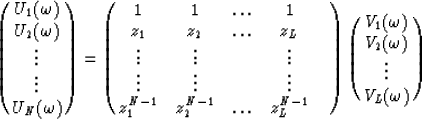
If equation (2) is sampled in the x direction and we let bk become the time shift per trace interval corresponding to the kth linear event, then the data can be expressed in the following matrix form :
its Fourier transform and bk is a measure of the slope, all corresponding to the kth linear event.
If equation (2) is sampled in the x direction and we let bk become the time shift per trace interval corresponding to the kth linear event, then the data can be expressed in the following matrix form :
|  |
(3) |
or
| 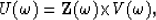 |
(4) |
where  is a frequency slice on the data
  ,
,
 and is the wavelet from (2).
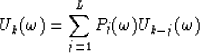
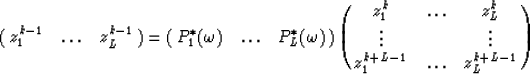
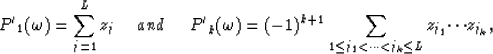
The Vandermonde matrix involved in equation (3) is of full column rank since the dips are distinct.
Therefore every row of this matrix may be expressed as a linear combination of the L previous rows :
and is the wavelet from (2).
The Vandermonde matrix involved in equation (3) is of full column rank since the dips are distinct.
Therefore every row of this matrix may be expressed as a linear combination of the L previous rows :
| 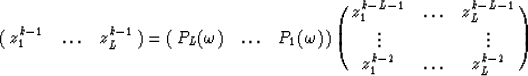 |
(5) |
for  .Notice that the coefficients
  to
to  are independent of the row number k because of the Vandermonde structure.
Multiplying on both sides by
are independent of the row number k because of the Vandermonde structure.
Multiplying on both sides by  , equation (5) becomes :
|  |
(6) |
or
|  |
(7) |
for . The meaning of the last equation is that in the case of strictly linear events, for each frequency, the data is predictable along the x axis with a one-step-ahead prediction filter.
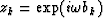
Considering equation (5) for k=L+1 it appears that z1 to zL are the roots of the polynomial  since in this case equation (5) is equivalent to
  .
Therefore the relations between the roots zj and the the coefficents
.
Therefore the relations between the roots zj and the the coefficents  are given by
|  |
(8) |
for  .Multiplying those equations by the conjugate of gives
 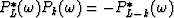 which shows that the zj are also the roots of
  for
for 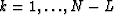 .This fact can be expressed in a form equivalent to equation (5)
|  |
(9) |
and after multiplication by as
|  |
(10) |
or
|  |
(11) |
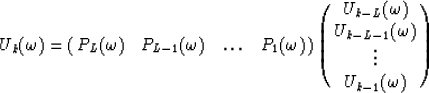
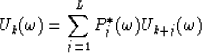
for .Like equation (7), equation (11) states that in the case of strictly linear events, for each frequency, the data is also predictable along the x axis with a one-step-backward prediction filter.
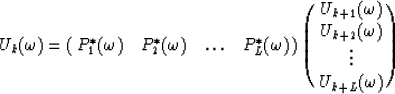
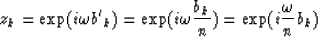
Let  be the prediction filter and b'k with
  be the time shift per trace interval for the interpolated data
  ; also let
 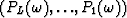 and bk with be the same parameters for the original data . The roots of
  are
are
|  |
(12) |
if a nth order interpolation is to be considered (the trace interval before interpolation equals n times the trace interval after interpolation).
Since
|  |
(13) |
replacing zj in equation (13) with  from equation (12) gives
| 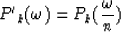 |
(14) |
for .
As stated at the beginning of this section, equations (7) and (11) show that linear events can be one-step forward-backward predicted and that the coefficients of the prediction filters for the original and the interpolated data are related through equation (14).
Those features can be used to implement an interpolation program, which is further discussed in the following section.
Next: THE PROGRAM
Up: Balog: Interpolation
Previous: Introduction
Stanford Exploration Project
12/18/1997