Next: Conclusions
Up: Karrenbach: slant stack redatuming
Previous: Interlacing
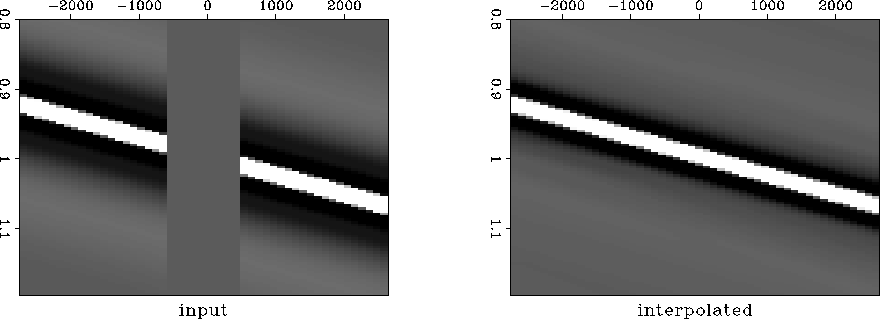
All the examples I showed above use linear events just to make
the concept clear.
In reality there are large amplitude variations across a section.
Effects of these large amplitudes can be equalized
by using some coherence measure and deriving a weighting function
to be applied in the slant stack domain.
Taner et al. (1971) define semblance in general terms. I rewrite their
definition in terms of slant stacks:
| 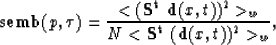 |
(6) |
where N is the number of ``live '' traces used in the slant stack and w is
a smoothing window. < ... > denotes simple averaging in that window.
The weighting function I applied to the p- domain is a simple
step function of the semblance coefficient,
killing everything below a certain threshold (let's say 10% of the maximum semblance coefficient).
Thus, weak, but spatially coherent events still have a good chance of being recovered, while
large but incoherent events are suppressed.
The data estimation is now nonlinear (since semb is a nonlinear function of
the data) and is described by
domain is a simple
step function of the semblance coefficient,
killing everything below a certain threshold (let's say 10% of the maximum semblance coefficient).
Thus, weak, but spatially coherent events still have a good chance of being recovered, while
large but incoherent events are suppressed.
The data estimation is now nonlinear (since semb is a nonlinear function of
the data) and is described by
|  |
(7) |
I tried several different weighting functions, such as weighting by powers of energy, but a semblance based weighting
was most versatile and effective in my tests.
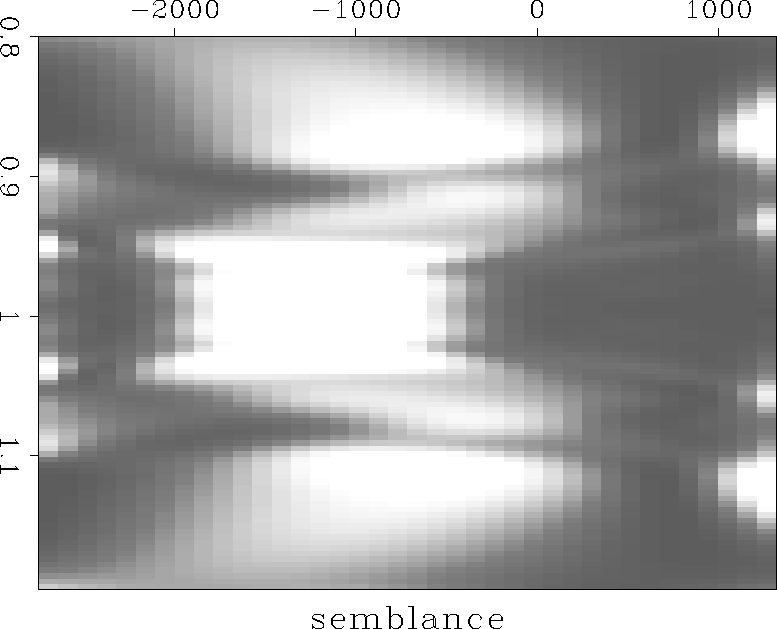
semblance
Figure 4 Semblance computed from the stack of the data squared and the squared stack of the data.
|
|  |


 interpolw
Figure 5 Interpolate dead traces and shift using a semblance weighted least squares stack.
Next: Conclusions
Up: Karrenbach: slant stack redatuming
Previous: Interlacing
Stanford Exploration Project
12/18/1997