

Next: CONCLUSIONS
Up: A MARINE SYNTHETIC DATA
Previous: Choice of parameterization
The previous section has illuminated the fact that
the accuracy of inversion results can vary depending on parameter choice,
data noise levels, and incomplete coverage of a target zone constrained
by acquisition geometry. In this section we briefly address the issue of
estimating a quantitative ``confidence'' criterion to display alongside
elastic parameter inversions. We believe our confidence maps can be of
great aid to guiding interpretations of inversion results. This work
is a currently ongoing part of our active research, and is in preparation
for journal publication.
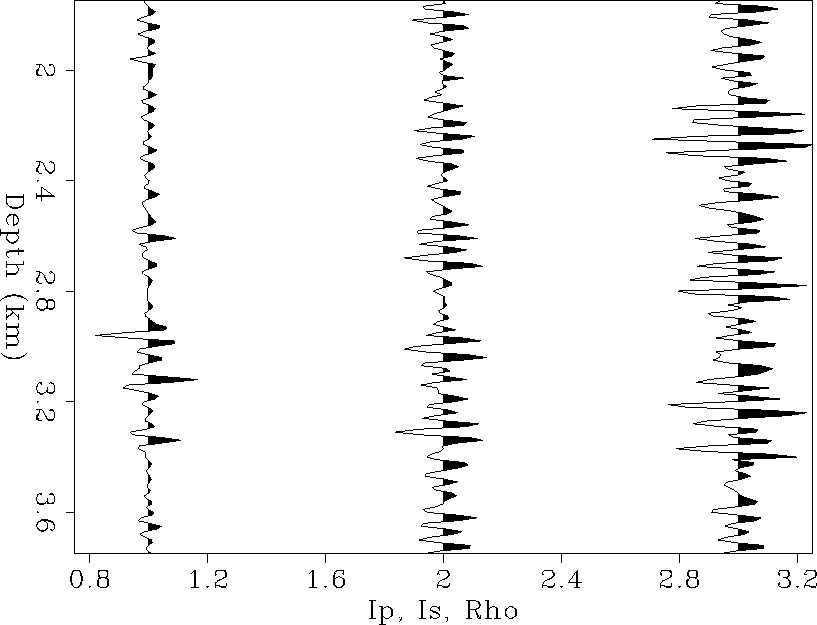
Figure ![[*]](http://sepwww.stanford.edu/latex2html/cross_ref_motif.gif) is the impedance inversion of the noisy gather
(Figure
is the impedance inversion of the noisy gather
(Figure ![[*]](http://sepwww.stanford.edu/latex2html/cross_ref_motif.gif) ),
tabulated in Table
),
tabulated in Table ![[*]](http://sepwww.stanford.edu/latex2html/cross_ref_motif.gif) , and should be compared to the noise-free inversion
in Figure
, and should be compared to the noise-free inversion
in Figure ![[*]](http://sepwww.stanford.edu/latex2html/cross_ref_motif.gif) . It is immediately obvious from
Figure
. It is immediately obvious from
Figure ![[*]](http://sepwww.stanford.edu/latex2html/cross_ref_motif.gif) that Ip is the
most robust parameter to noise, followed by Is, followed by
that Ip is the
most robust parameter to noise, followed by Is, followed by  .This agrees with our intuitive interpretation of the Impedance radiation
curves (Figure
 ![[*]](http://sepwww.stanford.edu/latex2html/cross_ref_motif.gif) ), and the values tabulated in Table
), and the values tabulated in Table ![[*]](http://sepwww.stanford.edu/latex2html/cross_ref_motif.gif) .
It is evident that
there are many false impedance changes in the inversion which are caused
by noise. We have developed a confidence measure which helps to discriminate
real from false impedance changes, and an overall quantitative measure
of the inversion's stability at each subsurface point.
.
It is evident that
there are many false impedance changes in the inversion which are caused
by noise. We have developed a confidence measure which helps to discriminate
real from false impedance changes, and an overall quantitative measure
of the inversion's stability at each subsurface point.
invnoise
Figure 11 Noisy marine synthetics impedance inversion: Ip, Is, and  .
.
 conf
conf
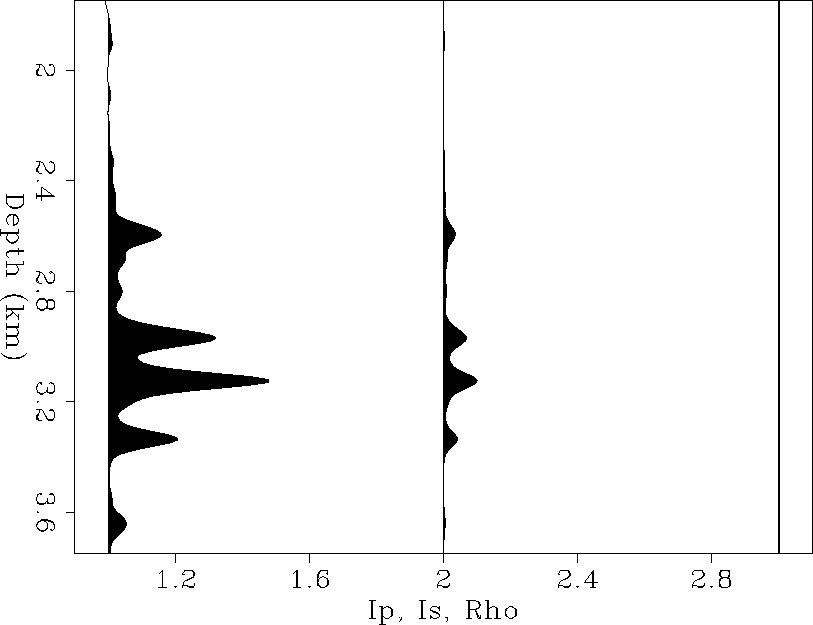
Figure 12 Impedance inversion ``confidence'' map for noisy synthetics.

Our inversion confidence estimates for the results of Figure ![[*]](http://sepwww.stanford.edu/latex2html/cross_ref_motif.gif) are
displayed in Figure
are
displayed in Figure ![[*]](http://sepwww.stanford.edu/latex2html/cross_ref_motif.gif) . Immediately, one can recognize from the
confidence maps that only four
events on the inversion traces are of reliable merit. These correspond
to four of the five correct events in the synthetic model. The fifth
event at 1960 m has low confidence because the random noise has
severely contaminated its AVO response as shown in Figure
. Immediately, one can recognize from the
confidence maps that only four
events on the inversion traces are of reliable merit. These correspond
to four of the five correct events in the synthetic model. The fifth
event at 1960 m has low confidence because the random noise has
severely contaminated its AVO response as shown in Figure ![[*]](http://sepwww.stanford.edu/latex2html/cross_ref_motif.gif) .
Comparison of
the lateral coherency and amplitude of events in Figure
.
Comparison of
the lateral coherency and amplitude of events in Figure ![[*]](http://sepwww.stanford.edu/latex2html/cross_ref_motif.gif) qualitatively
reinforces
the relative quantitative confidence estimates in Figure
qualitatively
reinforces
the relative quantitative confidence estimates in Figure ![[*]](http://sepwww.stanford.edu/latex2html/cross_ref_motif.gif) . However,
the peak confidence value is about 30%, which indicates that on the
whole, the inversion is having trouble with the noise level and
coherency. Furthermore,
it is evident that the confidence in Ip is about six times greater than
the confidence in Is, and there is little or no confidence in any of
the density variations. Finally, a false event due to coherent noise
at 3650 m is given some nonzero confidence because of its coherency in
the Rpp gather as shown in Figure
. However,
the peak confidence value is about 30%, which indicates that on the
whole, the inversion is having trouble with the noise level and
coherency. Furthermore,
it is evident that the confidence in Ip is about six times greater than
the confidence in Is, and there is little or no confidence in any of
the density variations. Finally, a false event due to coherent noise
at 3650 m is given some nonzero confidence because of its coherency in
the Rpp gather as shown in Figure ![[*]](http://sepwww.stanford.edu/latex2html/cross_ref_motif.gif) . Hence, our confidence estimates
can greatly aid in the appraisal of inversion results (evaluating their
worth and reliability from one location to another), but are not immune
to noise which is coherently correlated with reflection events.
. Hence, our confidence estimates
can greatly aid in the appraisal of inversion results (evaluating their
worth and reliability from one location to another), but are not immune
to noise which is coherently correlated with reflection events.
We now briefly describe the confidence criteria from a general perspective.
Readers interested in more detail can request a paper preprint from
the authors, or stay tuned for subsequent SEP reports.
The confidence measure consists of
objective numerical criteria calculated directly from the Rpp data
and the inversion step. From the Rpp data, we calculate quantitative
measures of
event coherency and average coherent amplitude, as a function of offset.
During the inversion step, we calculate the ``goodness of fit'' of the
parameter estimates to the Rpp values, and the eigenvalue spectrum
stability of the matrix system, at each subsurface location. The
confidence estimate is a function of these measures. A confidence value
of 100% means implies maximum offset coherency and amplitude in the
CDP gather, as well as a perfect fit of the parameter estimate to the
data, and maximum stability in the singular value decomposition.


Next: CONCLUSIONS
Up: A MARINE SYNTHETIC DATA
Previous: Choice of parameterization
Stanford Exploration Project
12/18/1997
![[*]](http://sepwww.stanford.edu/latex2html/cross_ref_motif.gif) is the impedance inversion of the noisy gather
(Figure
is the impedance inversion of the noisy gather
(Figure ![[*]](http://sepwww.stanford.edu/latex2html/cross_ref_motif.gif) ),
tabulated in Table
),
tabulated in Table ![[*]](http://sepwww.stanford.edu/latex2html/cross_ref_motif.gif) , and should be compared to the noise-free inversion
in Figure
, and should be compared to the noise-free inversion
in Figure ![[*]](http://sepwww.stanford.edu/latex2html/cross_ref_motif.gif) . It is immediately obvious from
Figure
. It is immediately obvious from
Figure ![[*]](http://sepwww.stanford.edu/latex2html/cross_ref_motif.gif) that Ip is the
most robust parameter to noise, followed by Is, followed by
that Ip is the
most robust parameter to noise, followed by Is, followed by ![[*]](http://sepwww.stanford.edu/latex2html/cross_ref_motif.gif) ), and the values tabulated in Table
), and the values tabulated in Table ![[*]](http://sepwww.stanford.edu/latex2html/cross_ref_motif.gif) .
It is evident that
there are many false impedance changes in the inversion which are caused
by noise. We have developed a confidence measure which helps to discriminate
real from false impedance changes, and an overall quantitative measure
of the inversion's stability at each subsurface point.
.
It is evident that
there are many false impedance changes in the inversion which are caused
by noise. We have developed a confidence measure which helps to discriminate
real from false impedance changes, and an overall quantitative measure
of the inversion's stability at each subsurface point.

