


![[*]](http://sepwww.stanford.edu/latex2html/cross_ref_motif.gif) a
shows the first sixteen Walsh functions, which form a complete set
describing sequences with sixteen samples. Two important characteristics
of the Walsh functions are their compactness (representing the lower order
functions requires fewer samples), and the simplicity and quickness of
their construction.
a
shows the first sixteen Walsh functions, which form a complete set
describing sequences with sixteen samples. Two important characteristics
of the Walsh functions are their compactness (representing the lower order
functions requires fewer samples), and the simplicity and quickness of
their construction.
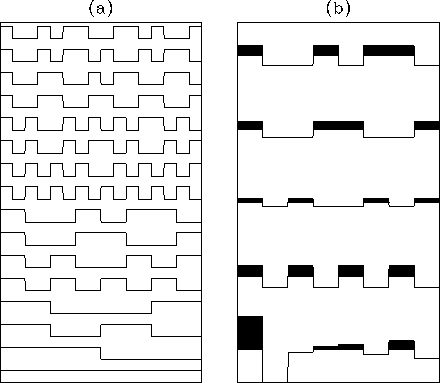 |

The following rules are used to generate the subset of Walsh functions corresponding to order N:
kN = 2N-1
.![]()
![]()
Beginning with the functions of order 0 (W0=1) and 1 (W1=1,-1), it is possible to generate a complete set by using this iterative process.
There is a direct relationship between Walsh functions and the
particular wavelet transform described by Ottolini (1990),
which had a two-sample signal function as the
basis wavelet. In contrast to the Walsh set, the wavelet set has only one
component of order N, but the number of parameters associated
with this component is equal to the number of Walsh functions of the
same order. Figure b shows that adding all
Walsh components of a given order results in the wavelet component
of the same order. In general, any wavelet component can be obtained
as a superposition of all the Walsh components of same order.
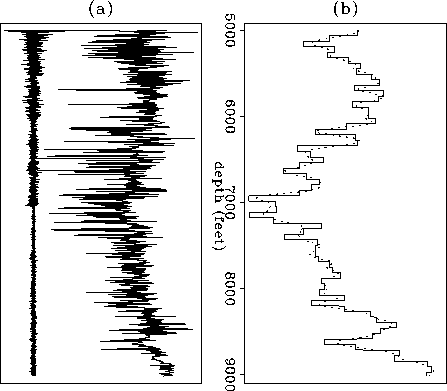
The Walsh functions have some properties that make them suitable
for certain geophysical applications. Lanning and Johnson (1983) used
the Walsh decomposition to develop an automated algorithm to identify
rock boundaries in well-log data. They claim that the discrete
transitions in signal level of these functions make them ideal for
describing layered media. Figure a shows a sonic-log
from the Gulf of Mexico and its Walsh spectrum, while Figure b
compares the sonic smoothed with a triangle filter, with a band-limited
(order 0 to 6 for a maximum order of 12) Walsh
composition of the same sonic-log. Both curves show the same basic
features, but the Walsh composition manifest a ``blocky" structure
that can be better correlated with the geologic layers.
 |
In traveltime inversion the advantage of using Walsh instead of Fourier decomposition lies in the simplicity of the forward modeling computation, since the samples of the basis functions can only assume values 1 or -1, and only a few samples are required to describe the lower frequency components. Replacing square functions by Walsh functions in the nonlinear scheme described in the preceding section leads to a solution similar to the set of equations (7).