|
|
|
|
Earthquake extraction and correlation energy at Long Beach, California seismic survey |
 seconds and
  seconds, respectively). Figure 6 and Figure 7 show the acausal and causal Green's functions from the
  hours of correlations from January
  to January
  . Figure 8 and Figure 9 show the acausal and causal Green's functions from the
  hours of correlations from February
  to February
. Figure 10 and Figure 11 show the acausal and acausal Green's functions from the
to February
. Figure 10 and Figure 11 show the acausal and acausal Green's functions from the  hours of correlations from February
  to February
  . Gaps in the array overlap with parts of the CSU Long Beach campus.
|
corr-Jan22-acausal-snap
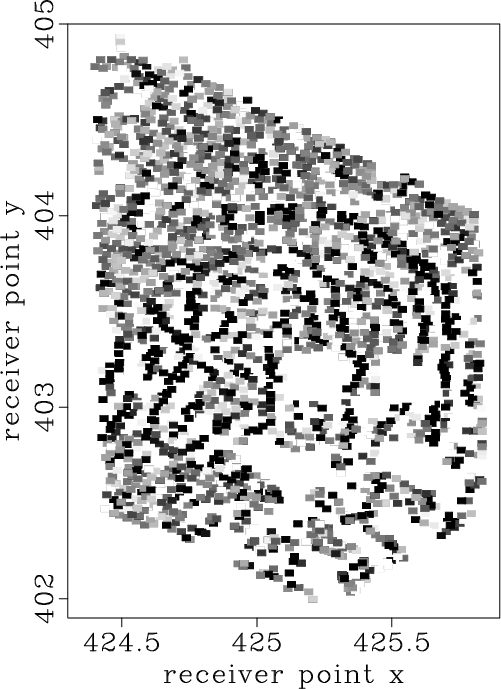
Figure 6. Snapshot of the Green's function at
second (acausal) time lag from the
hours of correlations from January
to January
.
|
|
|---|---|
|
|
|
corr-Jan22-causal-snap
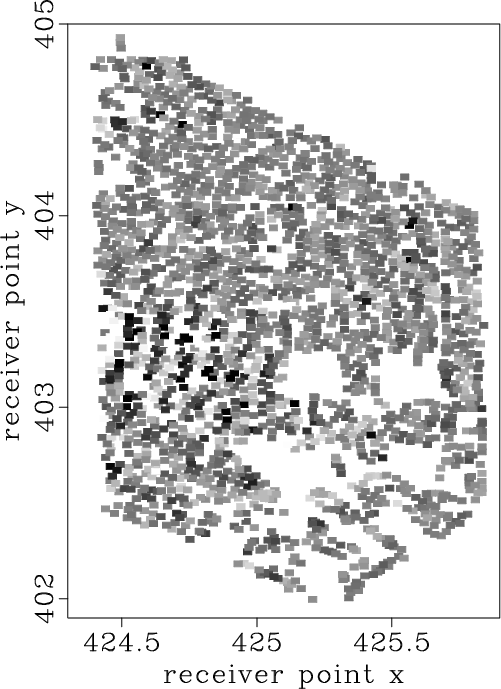
Figure 7. Snapshot of the Green's function at
second (causal) time lag from the
hours of correlations from January
to January
.
|
|
|---|---|
|
|
|
corr-Feb21-acausal-snap
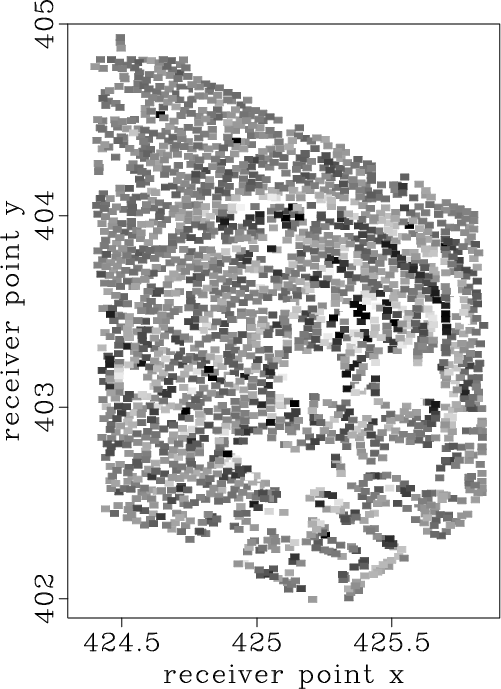
Figure 8. Snapshot of the Green's function at
second (acausal) time lag from the
hours of correlations from February
to February
.
|
|
|---|---|
|
|
|
corr-Feb21-causal-snap
Figure 9. Snapshot of the Green's function at
second (causal) time lag from the
hours of correlations from February
to February
.
|
|
|---|---|
|
|
|
corr-Feb28-acausal-snap
Figure 10. Snapshot of the Green's function at
second (acausal) time lag from the
hours of correlations from February
to February
.
|
|
|---|---|
|
|
|
corr-Feb28-causal-snap
Figure 11. Snapshot of the Green's function at
second (causal) time lag from the
hours of correlations from February
to February
.
|
|
|---|---|
|
|
|
|
|
|
Earthquake extraction and correlation energy at Long Beach, California seismic survey |