|
|
|
|
Correlation energy between surface and borehole stations at the Valhall field |
 -hour and
  -minute segments. We tapered the first and last
minutes of each segment with a smooth cosine-squared taper to avoid truncation artifacts that could arise when bandpassing. We then bandpassed the segments of data recorded at both borehole and surface stations between
-minute segments. We tapered the first and last
minutes of each segment with a smooth cosine-squared taper to avoid truncation artifacts that could arise when bandpassing. We then bandpassed the segments of data recorded at both borehole and surface stations between  Hz and
  Hz to be similar to the virtual Scholte-wave frequencies seen in de Ridder and Dellinger (2011). For time sections displaying instrument malfunction, we centered a smooth notch taper at the problematic section prior to bandpassing. After bandpassing, we removed the resulting artificial spikes from problematic sections by another notch taper.
We cross-correlated all possible combinations of borehole and station recordings for each time segment. This consisted of all three components at each borehole station and the vertical component at each surface station. For each cross-correlation, we time-reversed the borehole recording before convolution. We then stacked cross-correlation results from all time patches to improve the signal-to-noise ratio.
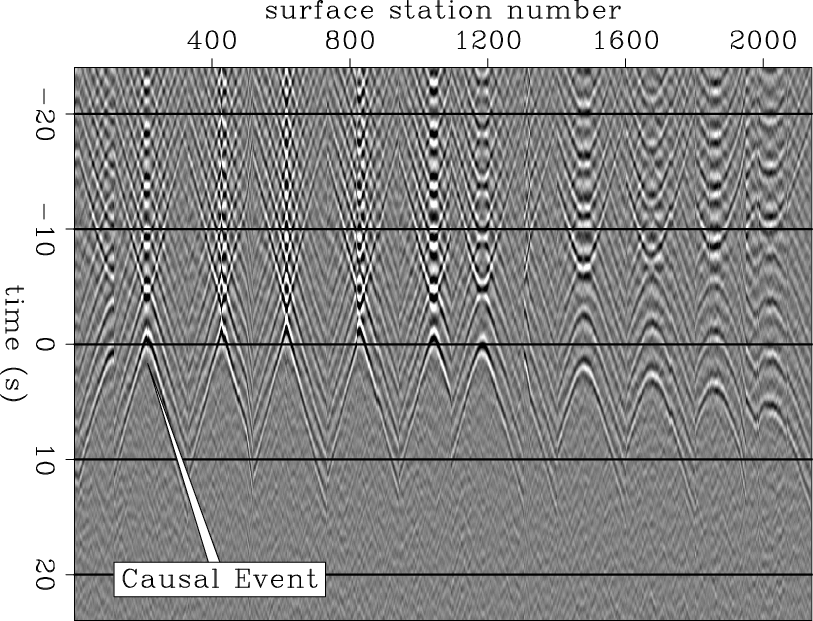
Figure 3 displays the cross-correlation results between  surface stations and the shallowest vertical borehole component (
 km depth). Cross-correlations between vertical components of other borehole stations and the surface stations produced similar results. There is generally one arrival visible in the causal correlation time lags but many in the acausal (negative) time lags. The event in (mostly) causal times forms a cone with the apex at a negative correlation time lag (approximately
  s). There is a mirror event (with time-reverse symmetry) in acausal times; the time of symmetry is again approximately
s. The acausal time window also contains a series of copies of both events at increasing negative time lags. The coherent energy is of relatively high frequency, and the wavelength is a few hundred meters. With wavelengths this short, coherent energy between the surface stations and stations at
s). There is a mirror event (with time-reverse symmetry) in acausal times; the time of symmetry is again approximately
s. The acausal time window also contains a series of copies of both events at increasing negative time lags. The coherent energy is of relatively high frequency, and the wavelength is a few hundred meters. With wavelengths this short, coherent energy between the surface stations and stations at 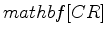 km depth cannot be explained by the skin depth of surface waves.
|
|---|
|
correlation
Figure 3. Result after cross-correlations between the shallowest borehole station (at
km depth) and the surface stations.
|
|
|
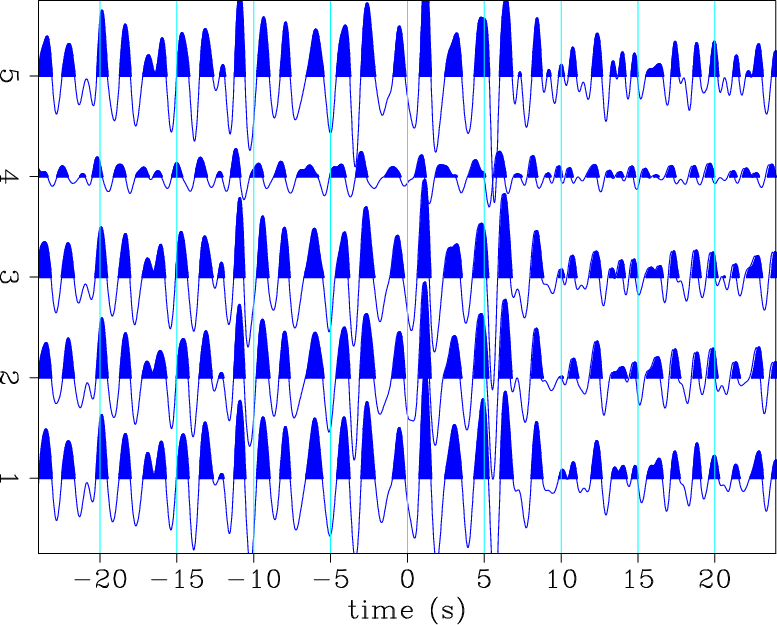
Figure 4 shows traces representing the correlation results between a surface station roughly  km north of the borehole stations and the vertical components of the borehole stations. The traces depict very similar results at both causal and acausal times. The main difference is that the correlation with the fourth borehole station is lower in amplitude. This might be due to an incorrect rotation of that particular borehole.
|
|---|
|
wiggle
Figure 4. Correlation results of surface station number 1785 with the five boreholes. This surface station is located roughly
km north of the borehole stations. Trace  is the correlation result with the shallowest borehole, and trace
  is the correlation result with the deepest borehole. Note the similarity of the shapes of the traces but the drastic decrease in amplitude of borehole station
  .
.
|
|
|
Another way to look at the correlation results is in map view. Figure 5 plots the correlation results when  s. A strong amplitude, circular wavefront is formed by the coherent energy between the borehole station and the surface stations. This wavefront suggests that the virtual source is centered about a location quite a distance away from the lateral position of the borehole stations. This center happens to coincide with the location of an offshore platform, which is where the top of the borehole is located.

|
|---|
|
frame
Figure 5. Snapshot of the wavefront propagating outward from the virtual source. Note how the virtual source location appears to be northwest of the borehole station location  km and
  km (smaller circle). This source location is near an offshore platform
  km and
  km (larger circle).
|
|
|
|
|
|
|
Correlation energy between surface and borehole stations at the Valhall field |