|
|
|
|
Correlation energy between surface and borehole stations at the Valhall field |

 -component stations on the seafloor and
 -component stations in a single borehole recorded ambient seismic noise at the Valhall field continuously for approximately
days. The ocean bottom stations were densely sampled in-line (
-component stations in a single borehole recorded ambient seismic noise at the Valhall field continuously for approximately
days. The ocean bottom stations were densely sampled in-line ( m) and sparsely sampled cross-line (
 m). The borehole stations were spaced roughly
  m apart laterally and
  m apart vertically within a deviated wellbore at a depth of almost
 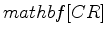 km. They have average Universal Transverse Mercator (UTM) coordinates
  km easting and
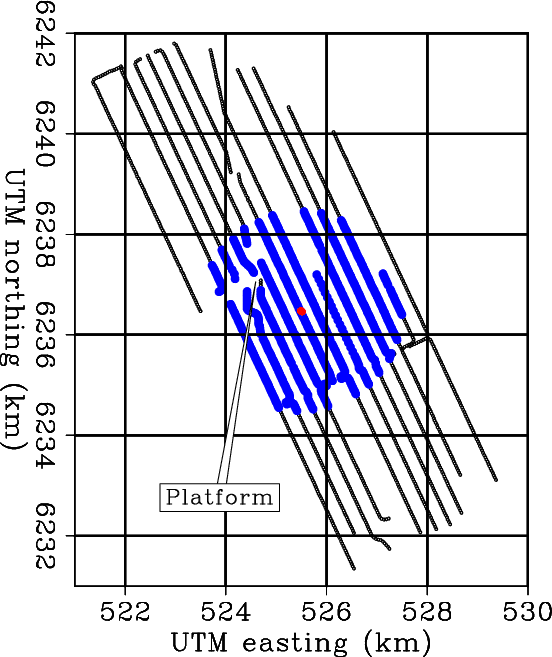
  km northing. Figure 1 shows the surface array and the surface projections of the borehole stations in map view. The borehole extends from an offshore platform, which is located at approximate UTM coordinates
  km easting and
  km northing.
|
|---|
|
xytot
Figure 1. Distribution of seismic stations at Valhall. Black and blue circles are surface stations, with blue representing those stations within
km of the average surface projection of the five borehole stations. Red circles depict the five borehole stations, which are all at nearly
km depth. The location of the platform is also shown.
|
|
|
Prior to creating any spectrograms or performing any cross-correlations, we had to adjust the borehole recordings. The three components at each borehole station were independently directed roughly north, west, and downward. Using a direction cosine matrix calculated from the provided azimuth and dip information of each component at each borehole station, we transformed these components to due north, due west, and direct downward.
|
|
|
|
Correlation energy between surface and borehole stations at the Valhall field |