|
|
|
|
Wave-equation migration velocity analysis for anisotropic models on 2-D ExxonMobil field data |
The provided anisotropic model shows high spatial correlation between vertical velocity and
Thomson parameters. Figure 8 shows a cross-plot among the parameters  ,
,  and
and 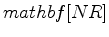 down to
  km.
The scatter plot shows distinct differences on different sides of the fault. Assuming these differences are based on the
local geology and lithology, we should include this information into our model-building process in future work, possibly as a preconditioning constraint suggested by Li et al. (2011).
km.
The scatter plot shows distinct differences on different sides of the fault. Assuming these differences are based on the
local geology and lithology, we should include this information into our model-building process in future work, possibly as a preconditioning constraint suggested by Li et al. (2011).
|
|---|
|
3dexxon
Figure 8. 3D scatter plot for the anisotropic parameters
,
and
.
|
|
|
|
|
|
|
Wave-equation migration velocity analysis for anisotropic models on 2-D ExxonMobil field data |