Next: Patch from the qdome
Up: Example
Previous: Example
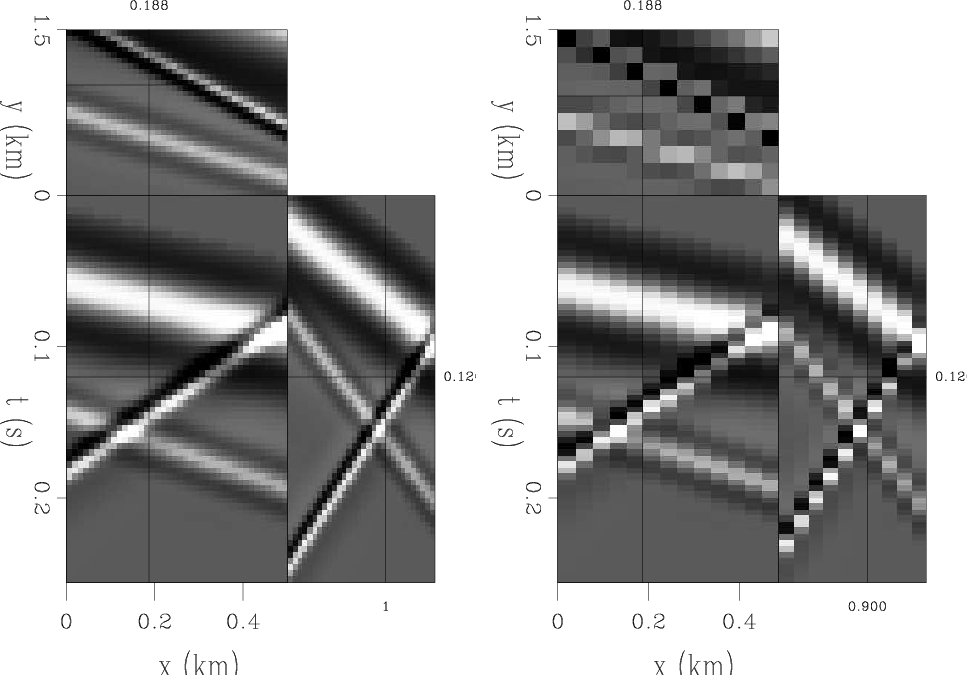
In this example, there are three plane-waves with different frequency components and dips (Figure 1a). I sub-sampled the data cube by a factor of three along both the  and
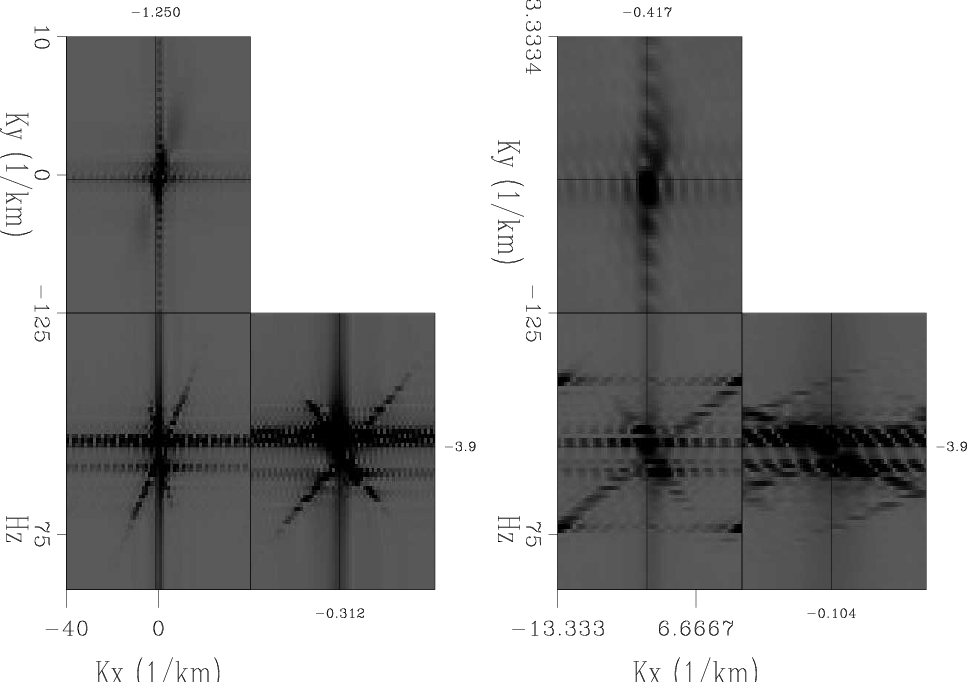
and  axes. This causes aliasing in two of the three plane-waves (Figure 1b), which can also be seen from their
  -
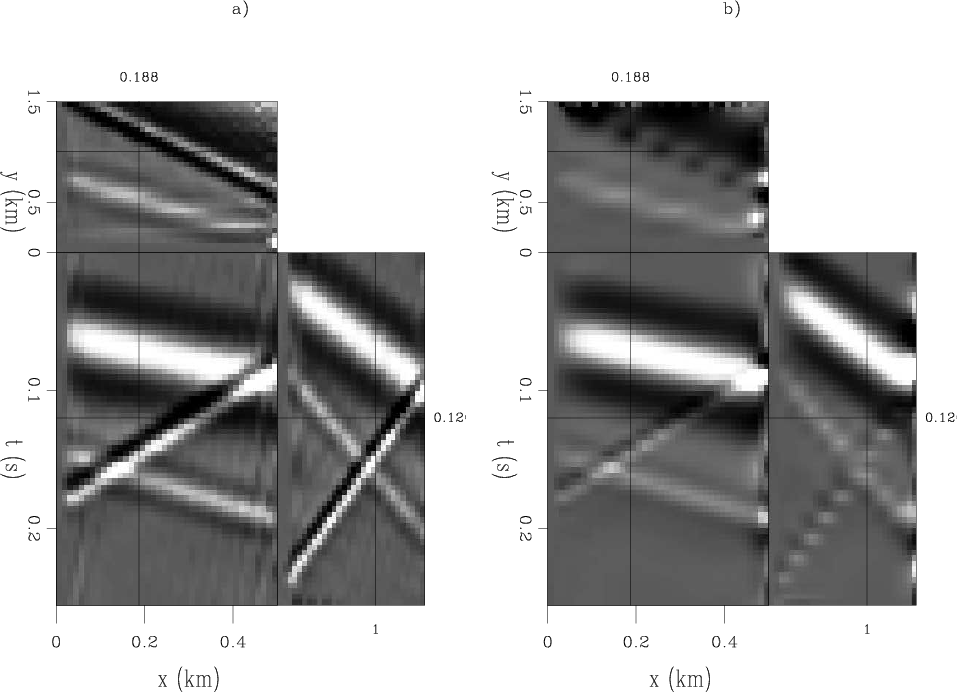
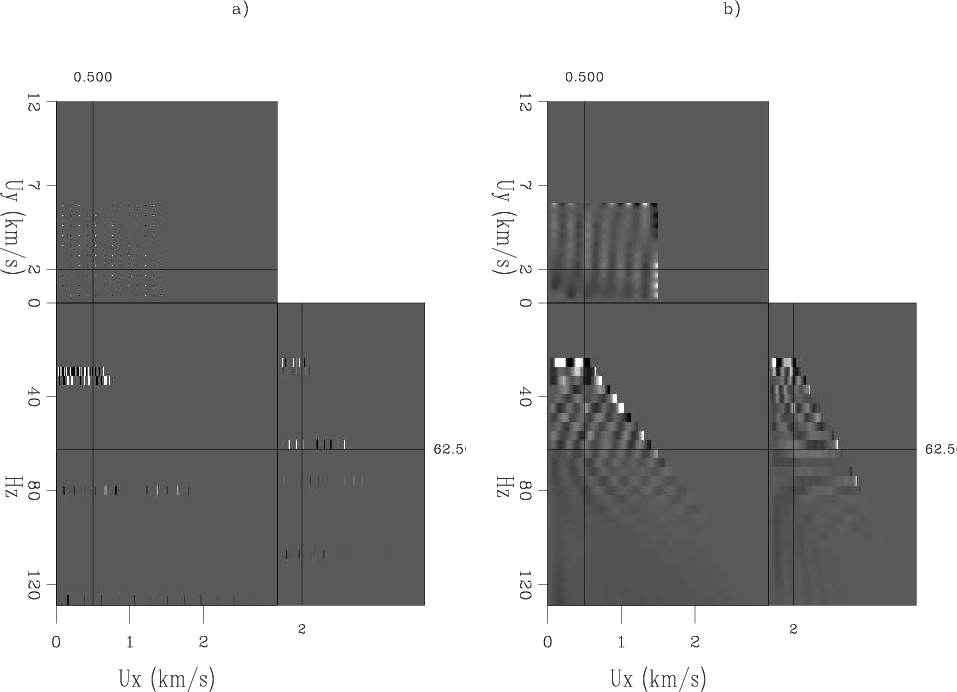
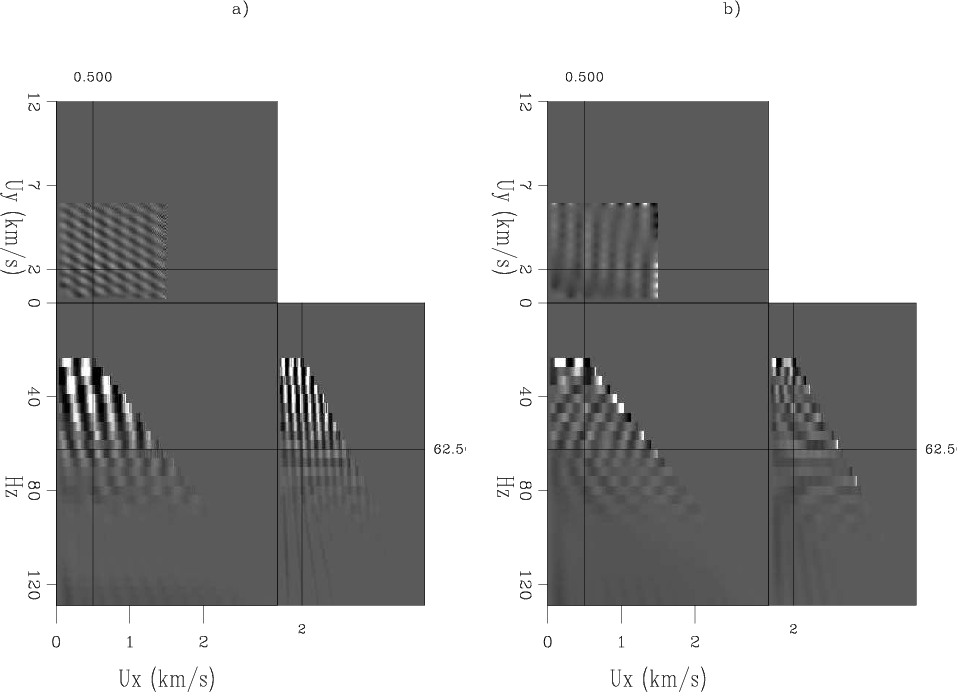
- spectrum( Figure 2). Then with the initial guess of the PEF being a 2D Laplacian operator, the above algorithms converged to a decent result at most places, except for data points close to the edges (Figure 3a). More specifically, the remaining data, after being transformed into the pyramid domain, looks like Figure 4a. There are a lot of holes, which are caused by missing data and big sampling factors (
 in equation 1) used in pyramid domain. In this example, a sampling factor of
  along the inline direction and a factor of
  along crossline direction are used to make sure we have enough sample to represent all the frequencies, especially low frequencies. With the initial guess of the PEF being a 2D Laplacian operator, these holes in the pyramid domain will be filled; however, since this is just a guess of the PEF, the filled information is not necessarily correct (Figure 5b). Actually, the
  -
- domain data of interpolation with this PEF are step-like functions for aliased plane-waves (Figure 3b). However, for the unaliased low-frequency plane-wave, the missing data is already correctly interpolated. After five iterations of the algorithm, using the information from low-frequency data, the interpolated data finally have the correct dips for all the frequency components (Figure 5a).
|
|---|
3pw
Figure 1. a) Original data, consisting
of three plane waves with different dips and frequency
contents. b) Sub-sampling by a factor of three along both and axes. [ER]
|
|---|
![[pdf]](icons/pdf.png) ![[png]](icons/viewmag.png)
|
|---|
|
|---|
wk3pw
Figure 2. a) The - spectrum of the original data.
b) The - spectrum of the sub-sampled data. [ER]
|
|---|
|
|
|---|
|
|---|
3pwi0
Figure 3. a) Interpolated data.
b) Data interpolated with the Laplacian operator in the pyramid domain. [CR]
|
|---|
|
|
|---|
|
|---|
py3pw0
Figure 4. a) Remaining data in the pyramid domain.
b) Data interpolated with the Laplacian operator in pyramid domain. [CR]
|
|---|
|
|
|---|
|
|---|
py3pw
Figure 5. a) Interpolated data (final version) in pyramid domain.
b) Data interpolated with the Laplacian operator in pyramid domain. [CR]
|
|---|
|
|
|---|
Next: Patch from the qdome
Up: Example
Previous: Example
2009-04-13